

The Bobcat UI
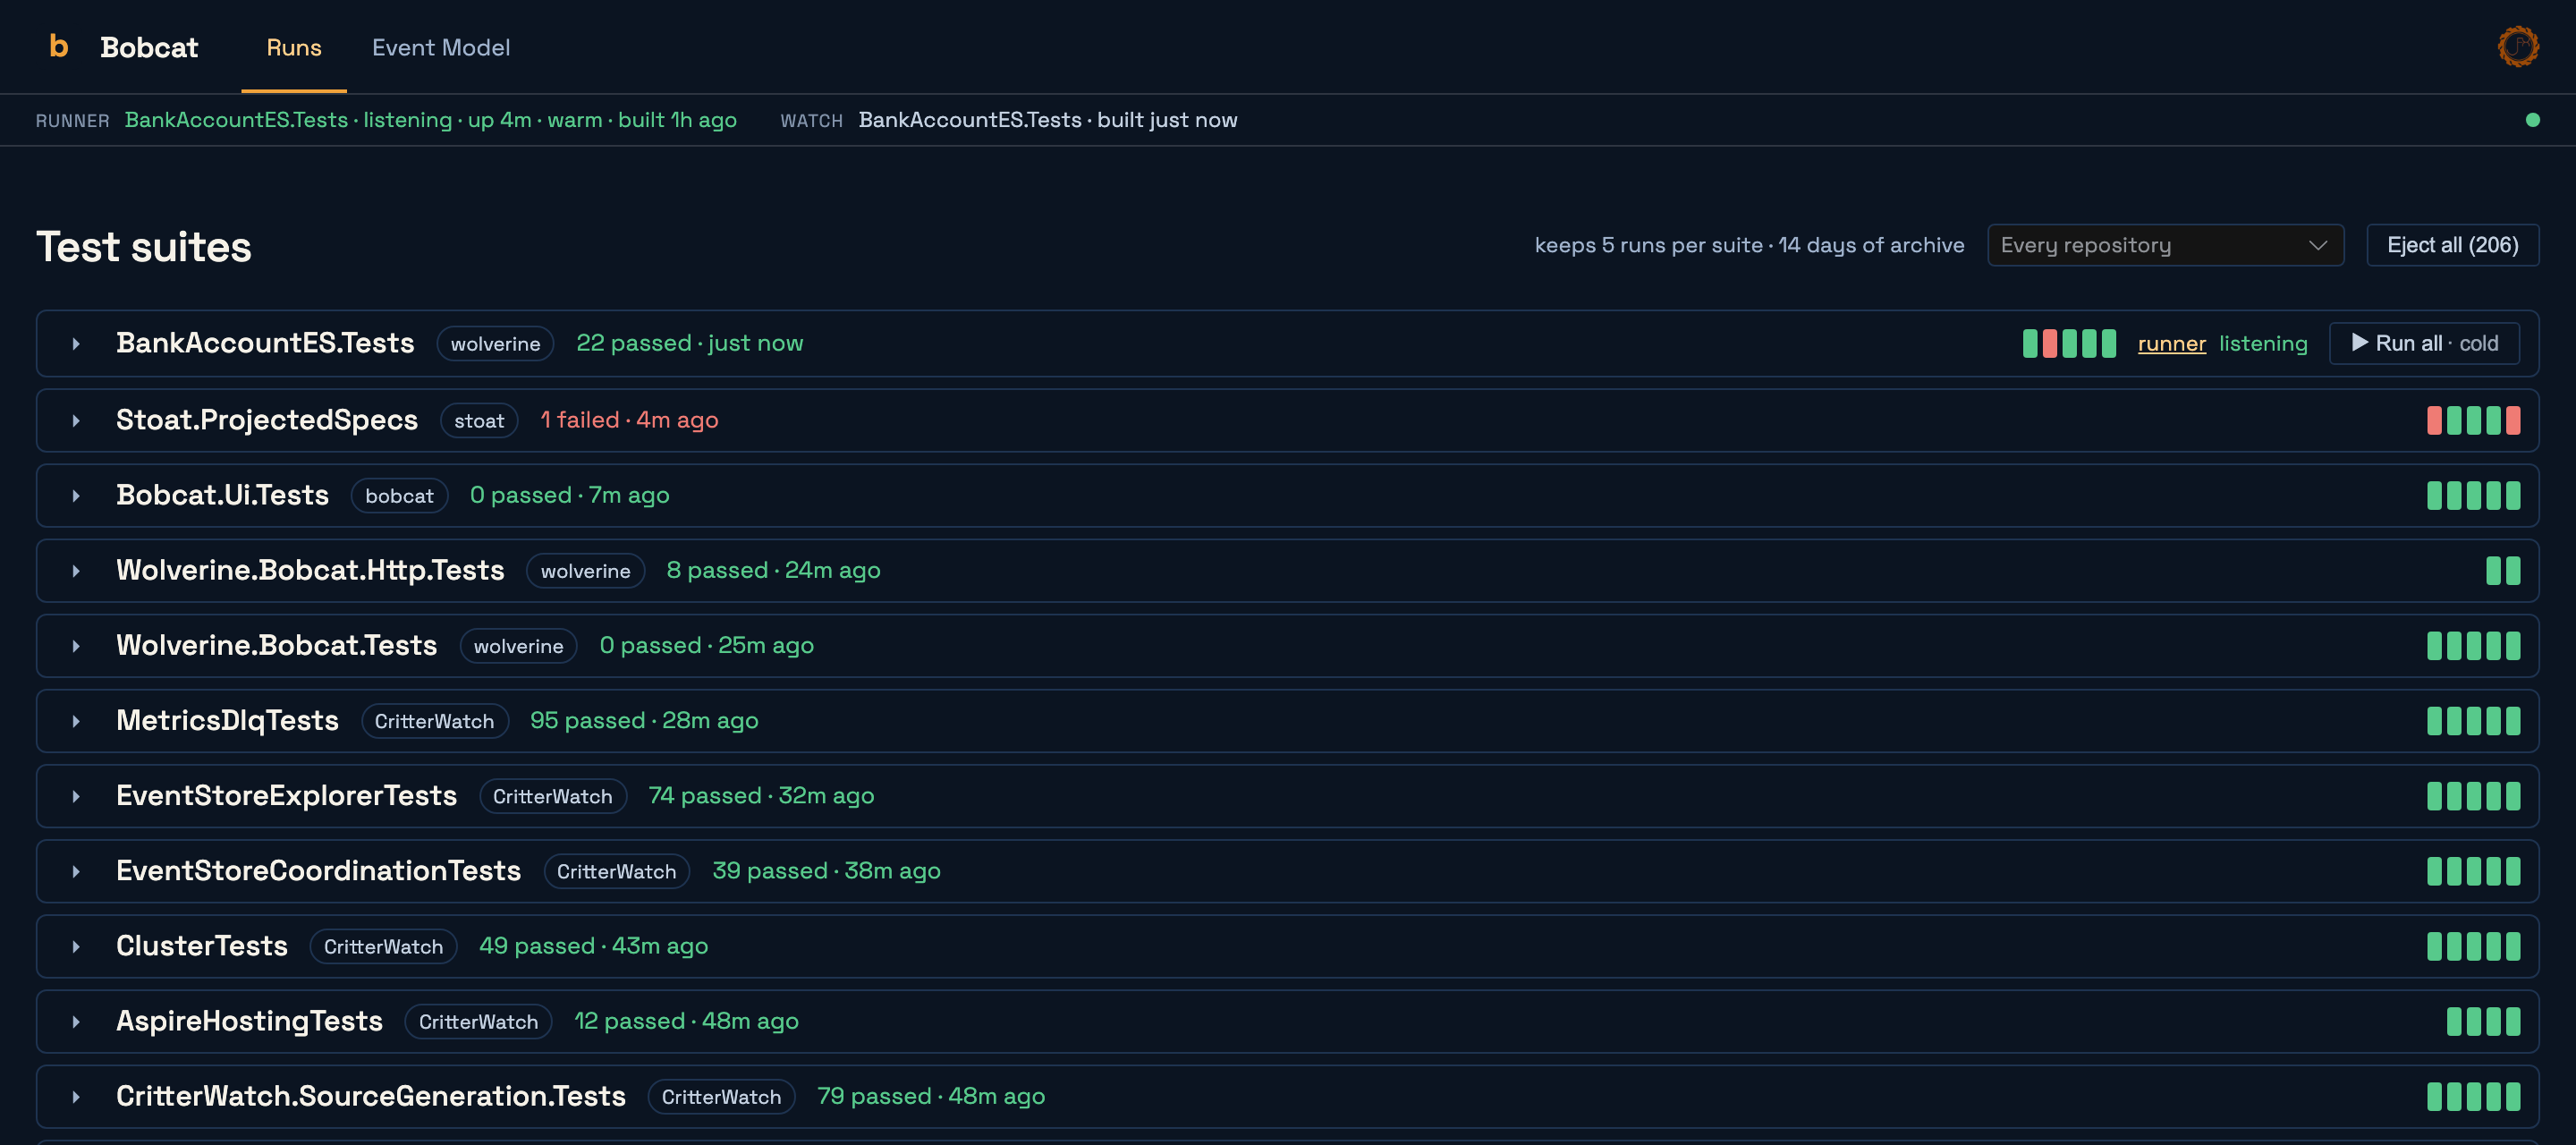
bobcat uibobcat ui serves the run board and the Event Model canvas on port 5525 and opens them in your browser, until you press Ctrl+C. The run board shows every Bobcat run on the box, live. The canvas draws your Event Model and colours each slice from the runs of the specifications bound to it.
It is part of the free bobcat tool, under the same MIT license as the rest of Bobcat. Visualizing the model and the specs that prove it is the part of spec driven development that has to be in everybody's hands, so it is.
Installing and updating
The UI ships inside the bobcat global tool. There is nothing else to install:
dotnet tool install -g Bobcat.Console     # first time
dotnet tool update -g Bobcat.Console      # after that
Launching it
bobcat ui                      # serve on 5525 and open the browser
bobcat ui --port 5600          # somewhere else
bobcat ui --no-browser         # serve, but leave the browser alone
Bobcat UI on http://localhost:5525 — the run board at http://localhost:5525/, the Event Model at http://localhost:5525/event-model
Ctrl+C to stop.| Flag | What it does |
|---|---|
-p, --port <port> | the port to listen on; 5525 by default, the address every Bobcat publisher probes |
-n, --no-browser | do not open a browser |
-i, --idle-shutdown | stop by itself after a stretch with nothing connected and nothing publishing -- two hours by default, BOBCAT_MONITOR_IDLE_MINUTES to change it. For a UI nobody is watching |
It is off unless you start it. Nothing about a test run depends on it: see the next section.
Pick a port other than 5525 only on purpose
A publisher looks for the UI at http://localhost:5525 unless BOBCAT_MONITOR_URL says otherwise, so a UI on another port sees only the runs that were told where it is.
How a test run finds it
A Bobcat run -- dotnet test on a spec project, bobcat run, the supervisor, a resident runner -- probes GET /api/ping once at startup with a tight timeout. If something answers, the run publishes its progress there as it goes. If nothing answers, the run publishes nothing for its whole life and is otherwise unaffected.
That is the one rule the whole design hangs on: a test run is never slowed or failed by the UI. Starting bobcat ui halfway through a run does not attach that run; the next one will appear.
| Variable | What it does |
|---|---|
BOBCAT_MONITOR_URL | where a run looks for the UI; http://localhost:5525 by default |
BOBCAT_MONITOR=0 | do not publish at all, not even the probe |
BOBCAT_MONITOR=1 | a console is expected: the probe waits up to 5s for it instead of 250ms (a resident runner sets this on every child) |
BOBCAT_RUN_TAG | an opaque label stamped on the run -- a ticket, a build number -- and shown with it |
The full publisher vocabulary is in What a Run Publishes.
The run board
The home page, at /runs. A row per suite, where a suite is the repository plus the suite name, so two worktrees of one repository are one suite and the branch stays a property of each run. A row shows the suite's latest result, a five-run history strip (oldest at the left, newest at the right -- each segment a link to its run, with the verdict, age and branch in its tooltip) and, when a resident runner is attached for the suite, the runner's state and its ▶ Run all · cold button. Suites with a live run sort first, then the rest by their most recent run; a runner whose suite has not run yet still has a row, so there is something to press before anything has run. The page states what the UI keeps (keeps 5 runs per suite · 14 days of archive, read from GET /api/retention, so it says what this UI is configured with).
Expanding a row shows the suite's retained runs as cards, newest first -- the first five, the rest on request -- each with its branch and mode, its counts, its age, how long it took, its exports and its Eject. A live run shows its overall progress under the row whether or not the row is expanded: tests done of the planned total (the run's own total; failing that the supervisor's, the specs a command selected, the runner's registered count, or the suite's last run), passed and failed so far, elapsed time, an estimate from the suite's previous runs' durations (the median, less what has elapsed; a suite with no history is extrapolated from its own pace), and Go to running. The bar is green while everything passes, red at the first failure, and amber while the only trouble so far is a retry.
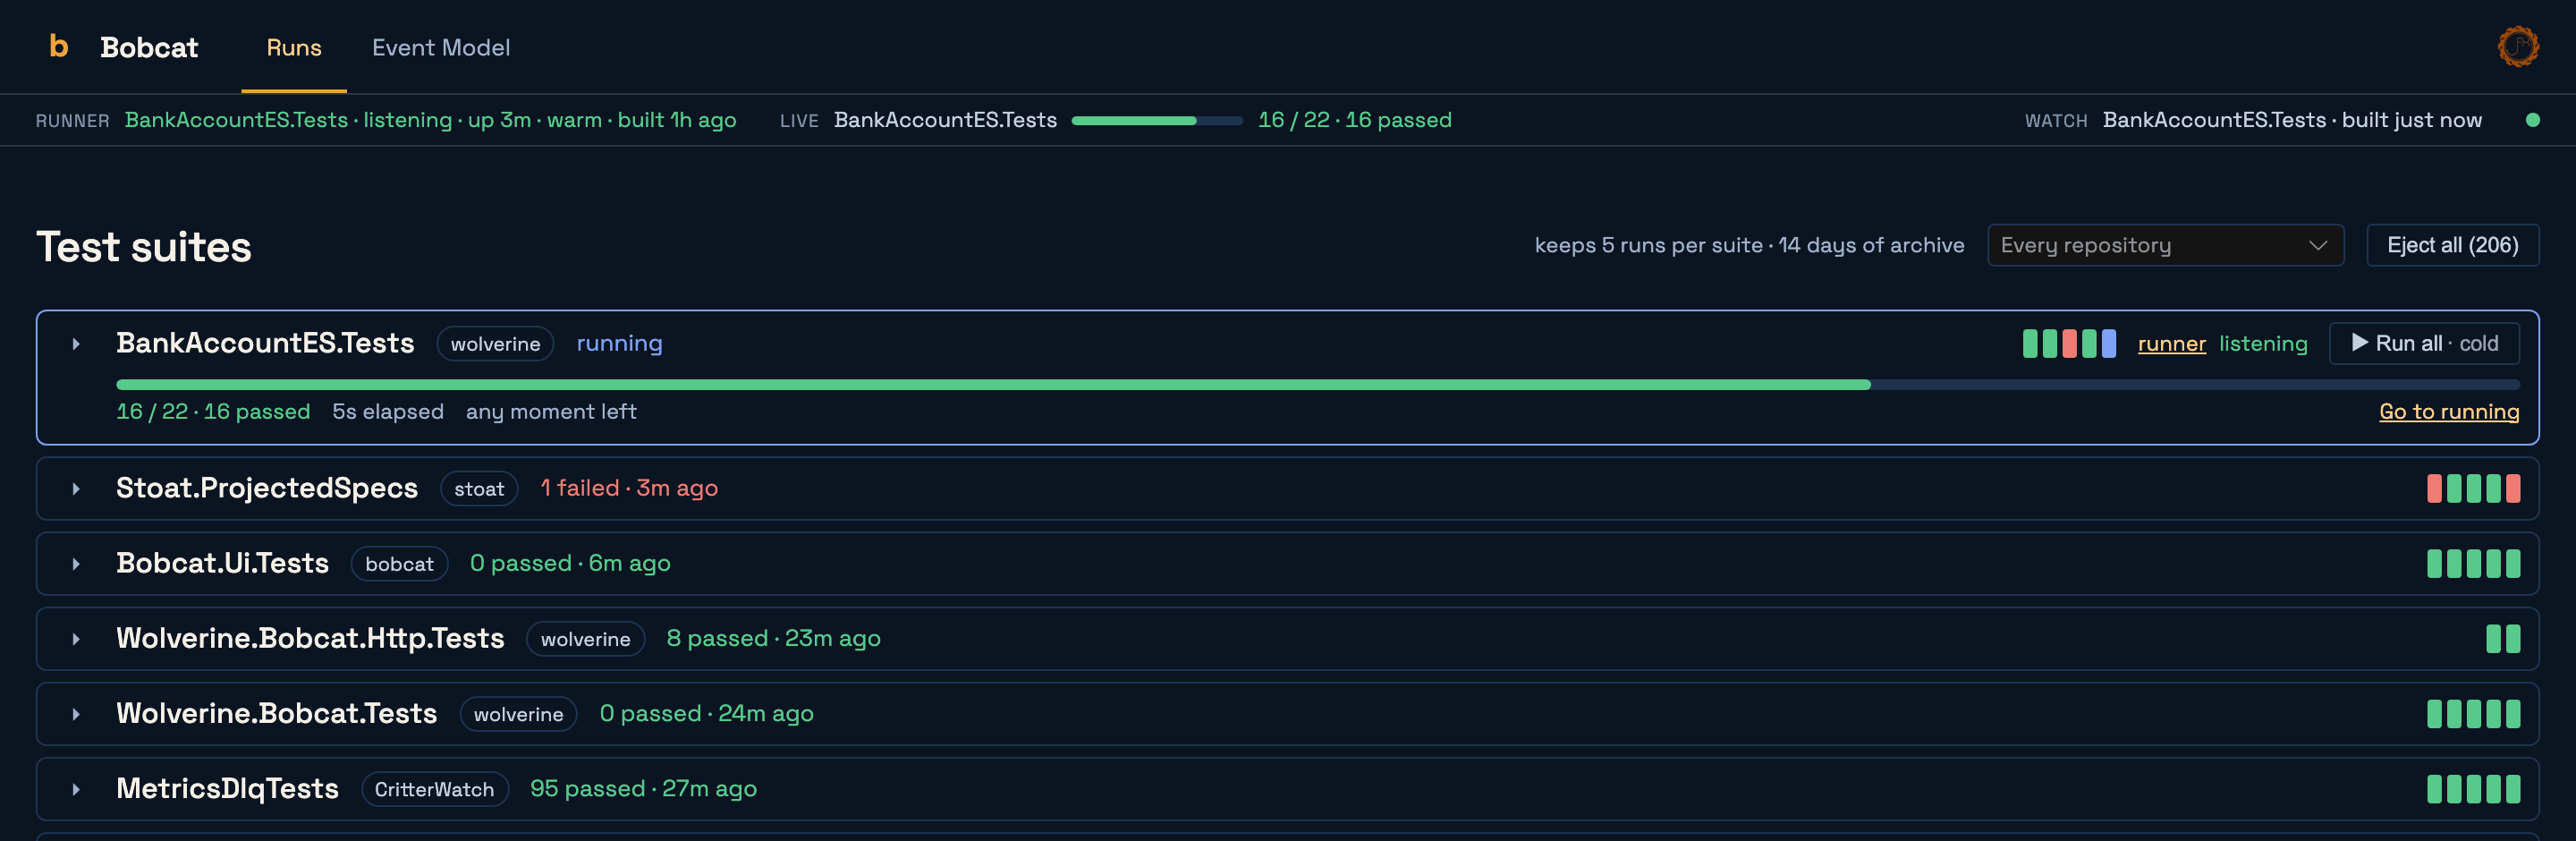
Run all is offered only where it can run (bobcat#798). A runner that is rebuilding still takes the command, which the UI holds until the runner is back. A runner that is not connected, has exited or failed to build cannot, so its row says how to start one instead: start a runner: bobcat resident <test host>. Until the board's first summary arrives, the page shows a loading placeholder rather than a partial board or a premature "No runs yet".
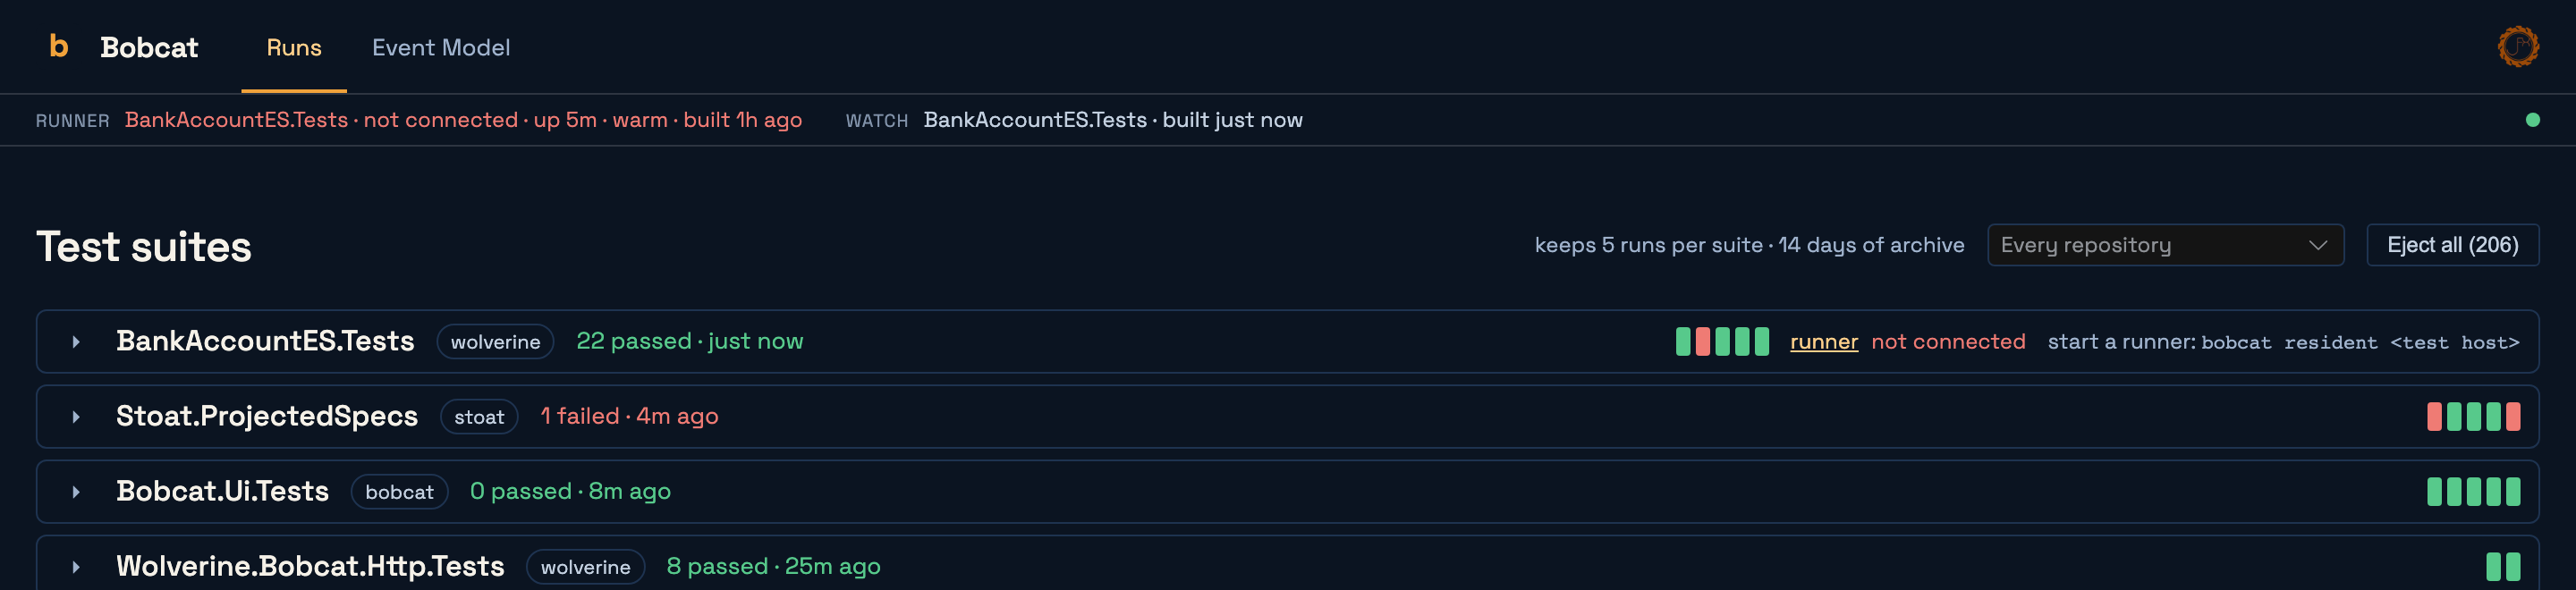
A status strip on every page, one line under the top navigation, the Event Model canvas included: the attached runner (its state, how long it has been up, whether it offers warm runs, when its code was built -- or, for a runner that is not connected, when it was last seen instead of an uptime; several runners fold into one segment with a dropdown), the build -- shown only when a watched project does not compile, and then the whole strip turns red, with the compiler errors a click away -- the live run with a mini progress bar (several live runs are a dropdown, filtered by the board's repository filter), watch when bobcat watch has reported a build, and the connection as a dot.
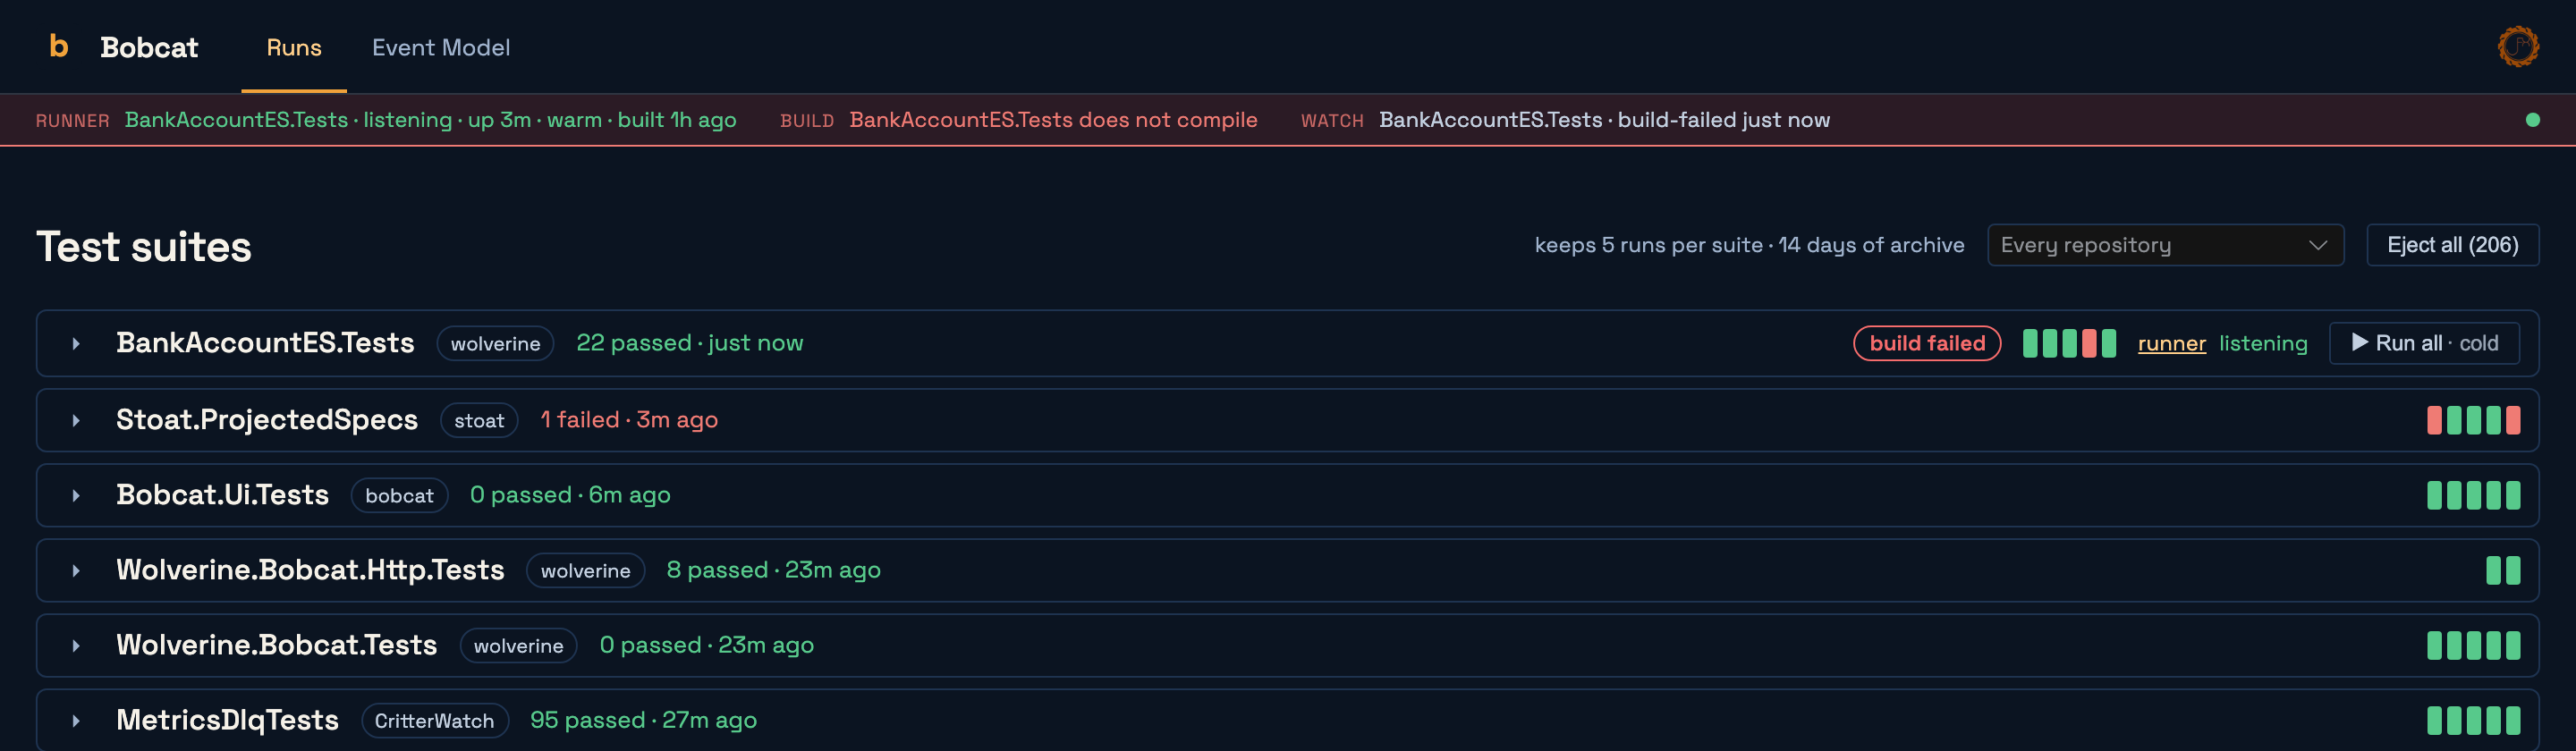
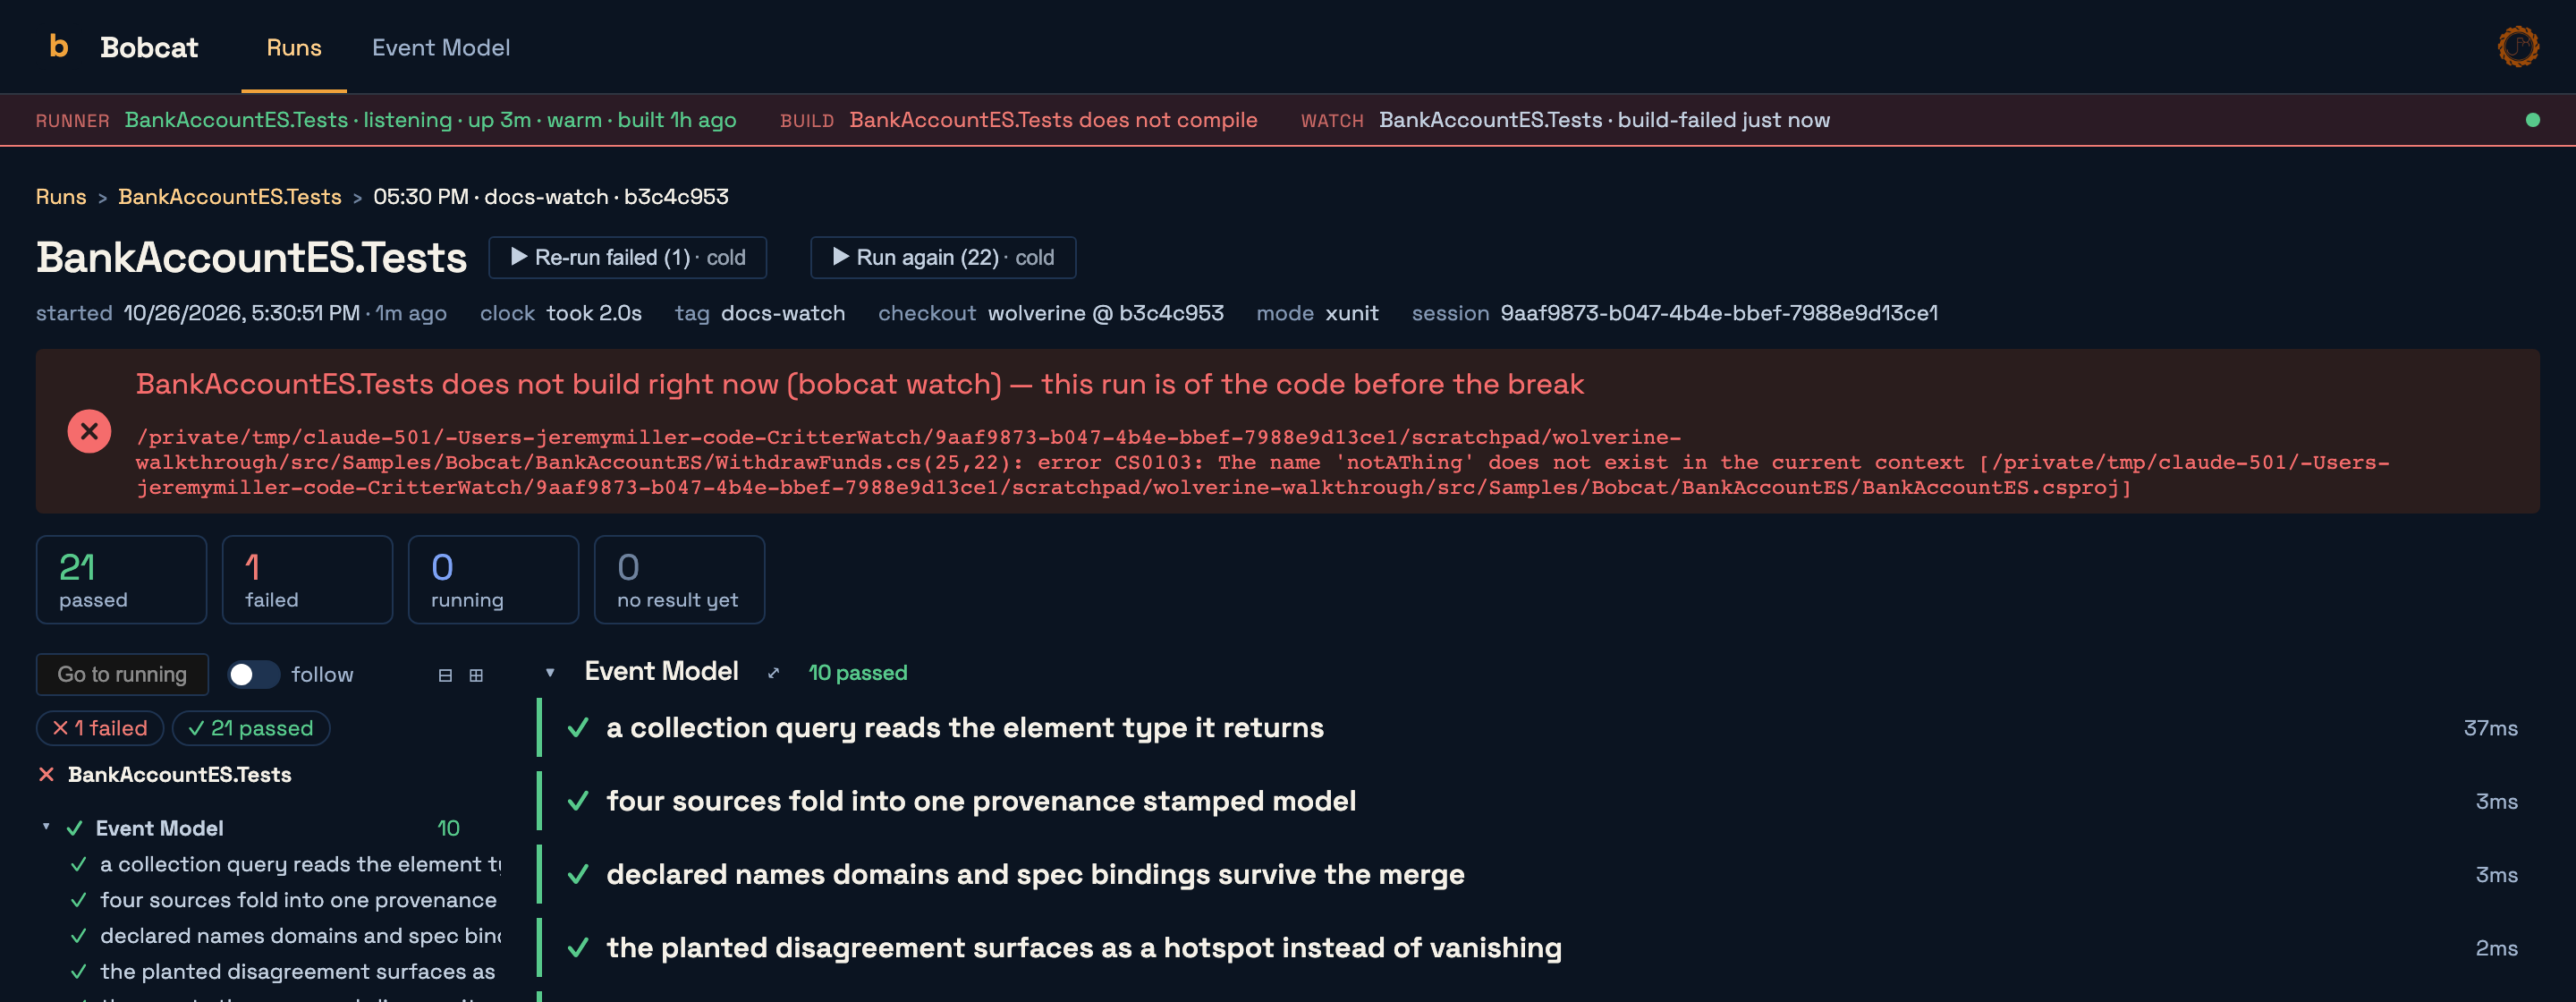
A broken build shows where you are looking (bobcat#795): the strip turns red on every page, the suite's own row carries a build failed chip (building… while it rebuilds), and the suite's run pages say the run is of the code before the break, with the compiler's errors. The build is matched to the suite by the suite's assembly name and the checkout, the same identity its runs report under, so a Tests.csproj that builds BankAccountES.Tests lights the BankAccountES.Tests row, and the same suite in another worktree is not blamed. The strip's error dialog closes itself once the next report says the build is fixed.
- Steps stream in for the scenario in flight: step n of N with elapsed time, row k of M for a table, and the interim message of a step that is polling.
- Retries and flakiness are reported honestly. A pass on a retry is counted and shown as one, never folded into a clean pass.
- A supervised run shows its topology: the lanes and what each was handed, what is running in each right now, recycled resources, worker faults with their exit code and standard error, stalled tests, and peak worker memory when sampling is on.
- Foreign suites count too. A supervised run of a plain xUnit or TUnit suite that publishes no scenarios of its own still gets per-test progress, forwarded by the supervisor in the framework's own words -- Passed, Failed, Skipped and so on.
- Orphans render as orphans. A run whose process died without finishing is marked orphaned rather than "running" forever: a run the UI hears nothing from for 30 seconds (three of the publisher's heartbeats;
BOBCAT_MONITOR_ORPHAN_SECONDSchanges it, zero turns it off) loses its progress bar, gains an Eject button, and is evicted like a finished run. Its next event, should the publisher only have been slow, makes it live again. A restarted UI orphans any run whose archive has no finish, as before. - The tag, session and command a run was launched with travel with it.
BOBCAT_RUN_TAG, the agent session that started the run and the console command that caused it are on the run's state in the board and on its page, for the views that show them. - Several repositories on one box are told apart by a repository filter, and a supervised run across several worker processes is one card, not one per worker.
- A project that no longer compiles says so, in the status strip on every page, with its first compiler errors a click away:
bobcat watchreports each rebuild to the UI, and so doesstoat runnerfor a resident runner it rebuilds. Until the build is fixed, the suite's runs are of the code before the change that broke it.
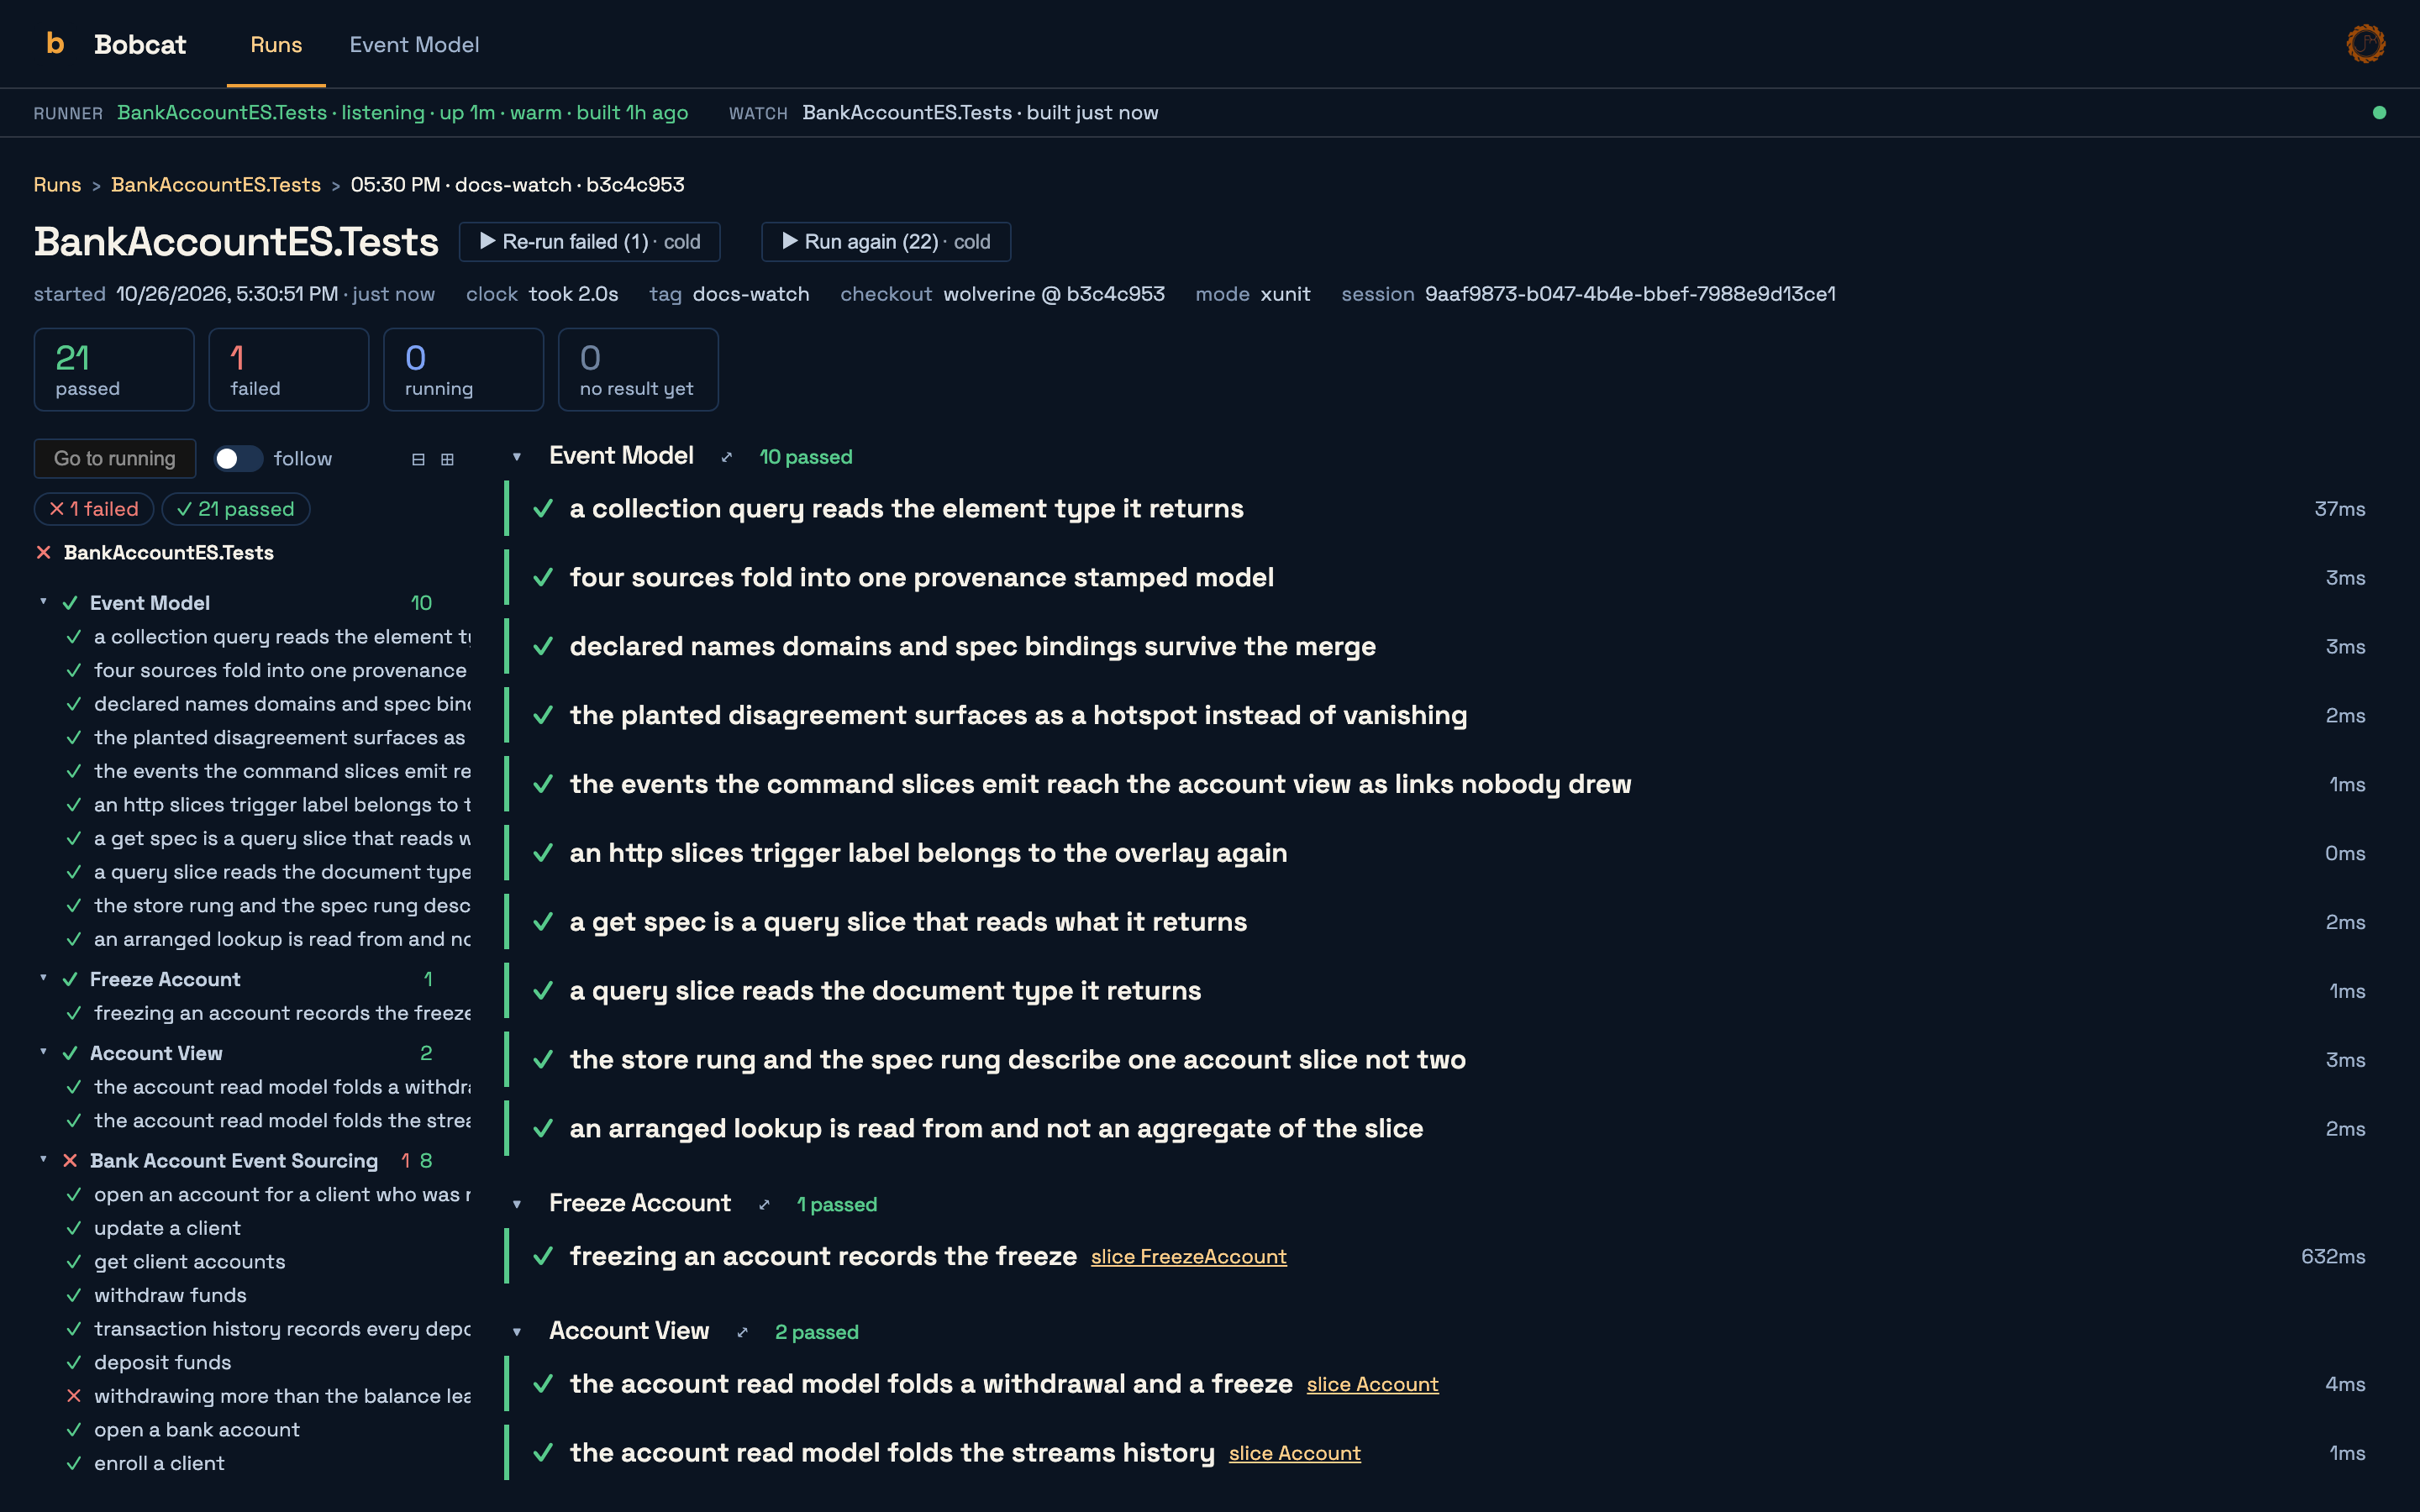
A run's page opens from its card. It leads with a breadcrumb trail -- Runs › suite › run -- whose run segment carries the run's identity (when it started, its tag, its branch), then the run's header: when it started, one labelled clock (how long it took, or how long it has been going), its tag, the checkout and branch (the full path is the tooltip), its mode and the command that caused it, and the agent session if any. Summary tiles count passed, failed, running, no result yet and passed on retry, and while the run is live the same overall progress bar the board's suite row shows: done of the planned total, elapsed and an estimate, green until the first failure and red after it. Down the side is a table of contents: the suite tree, suite › feature › scenario, with a live status on every node and the counts per feature. A tile or a chip filters it and the page by status, clicking a node scrolls to it, Go to running scrolls the running scenario into view, and follow keeps it there as the run advances. A passed scenario is folded to its line; a failed or running one is open on its specification, and any of them opens with a click.
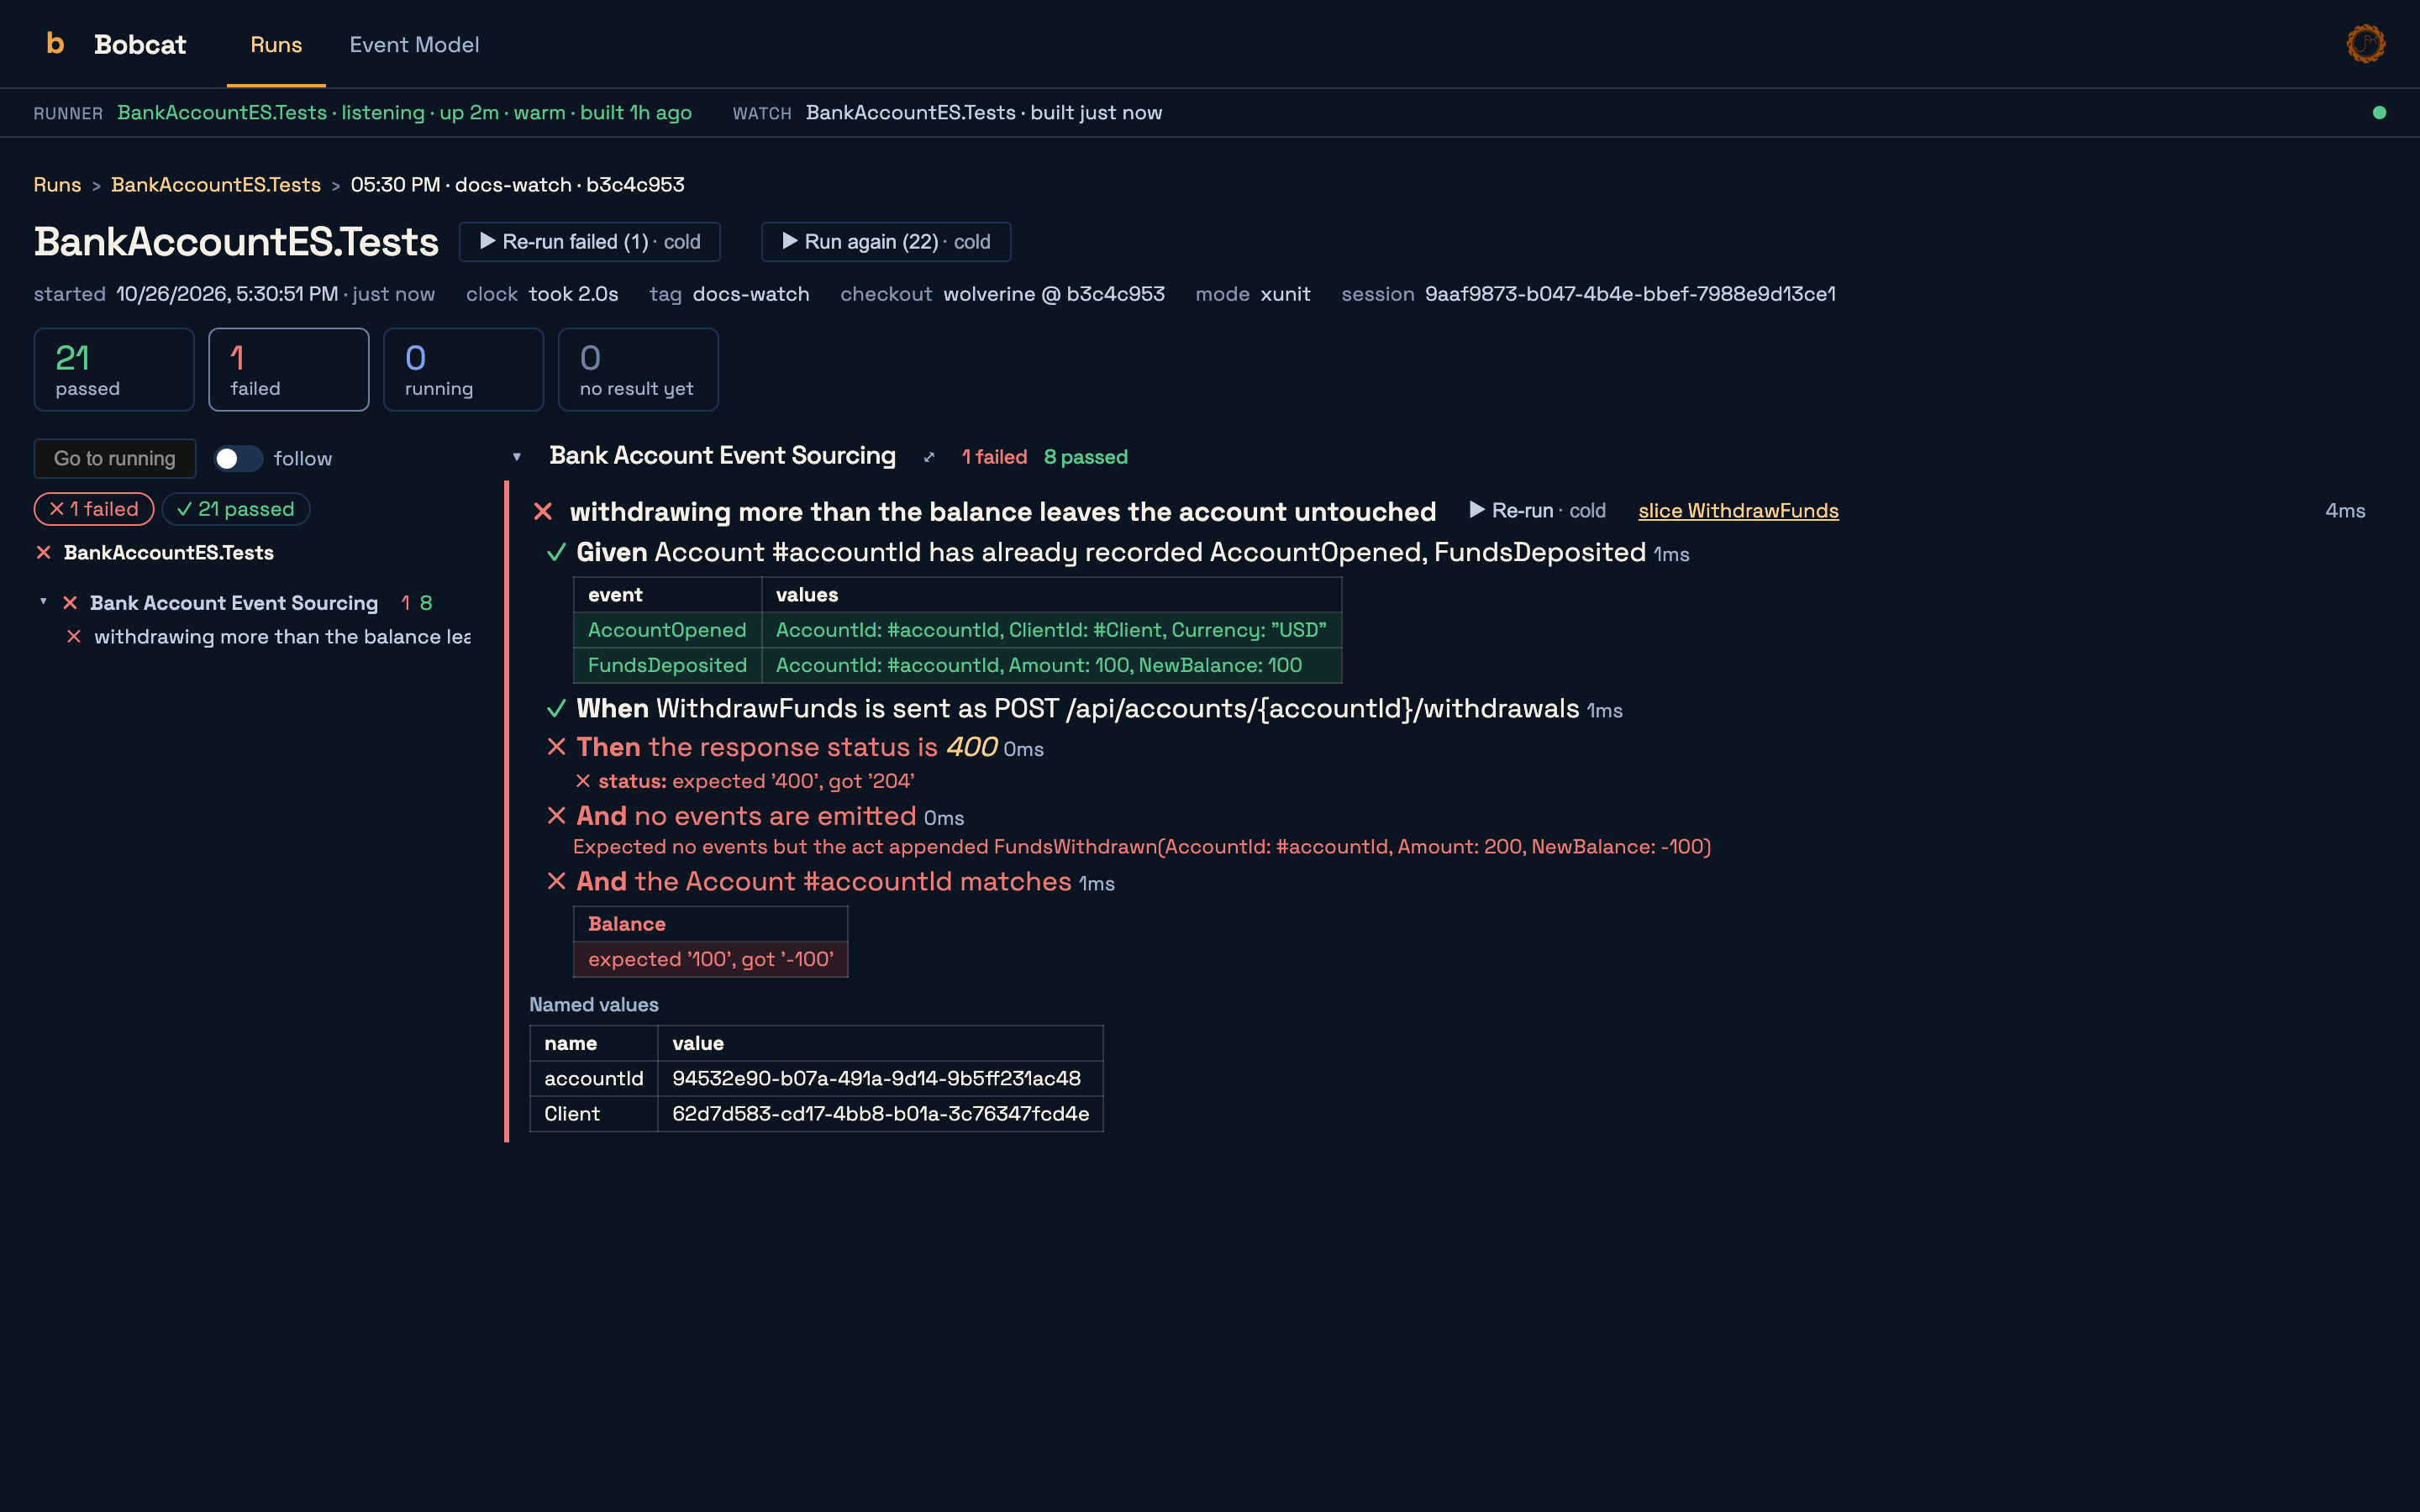
Filtering to failed (a tile, a chip, or ?status=failed in the URL) leaves just the failures, each open on its specification: which steps failed, the named comparisons that did not hold, and the Given the scenario started from.
Big suites (bobcat#801):
- The tree goes as deep as the suite does. A Bobcat specification sits under its feature. A supervised xUnit or TUnit test has no feature, so it sits under the namespace and class its name gives:
Tests.Services.AlertTests.raises_onceisraises_onceunder Tests › Services › AlertTests. A level that only leads to one other level is shown as one node (Tests.Services), and every node carries the counts of everything beneath it. - Fold and unfold any node with its ▸/▾, on the rail or on the page (they share one state), or all of them at once with ⊟ / ⊞ beside follow. On a run of more than 100 scenarios a node that passed starts folded, so what failed or is running is what you see on arrival. A status filter shows everything it matches unfolded, and Go to running or a link into a section unfolds the way to it.
- Zoom into any node with ⤢: it becomes the whole page, its tiles and counts included. The trail grows a crumb per level (
Runs › suite › run › Tests › Services), so the run segment goes back to the whole run and each level back to itself. Go to running zooms out when the running test is outside the node. - The zoom and the filter are in the URL:
?in=suite:Tests.Services&status=failedarrives zoomed and filtered, and a crumb keeps the filter as it zooms out.
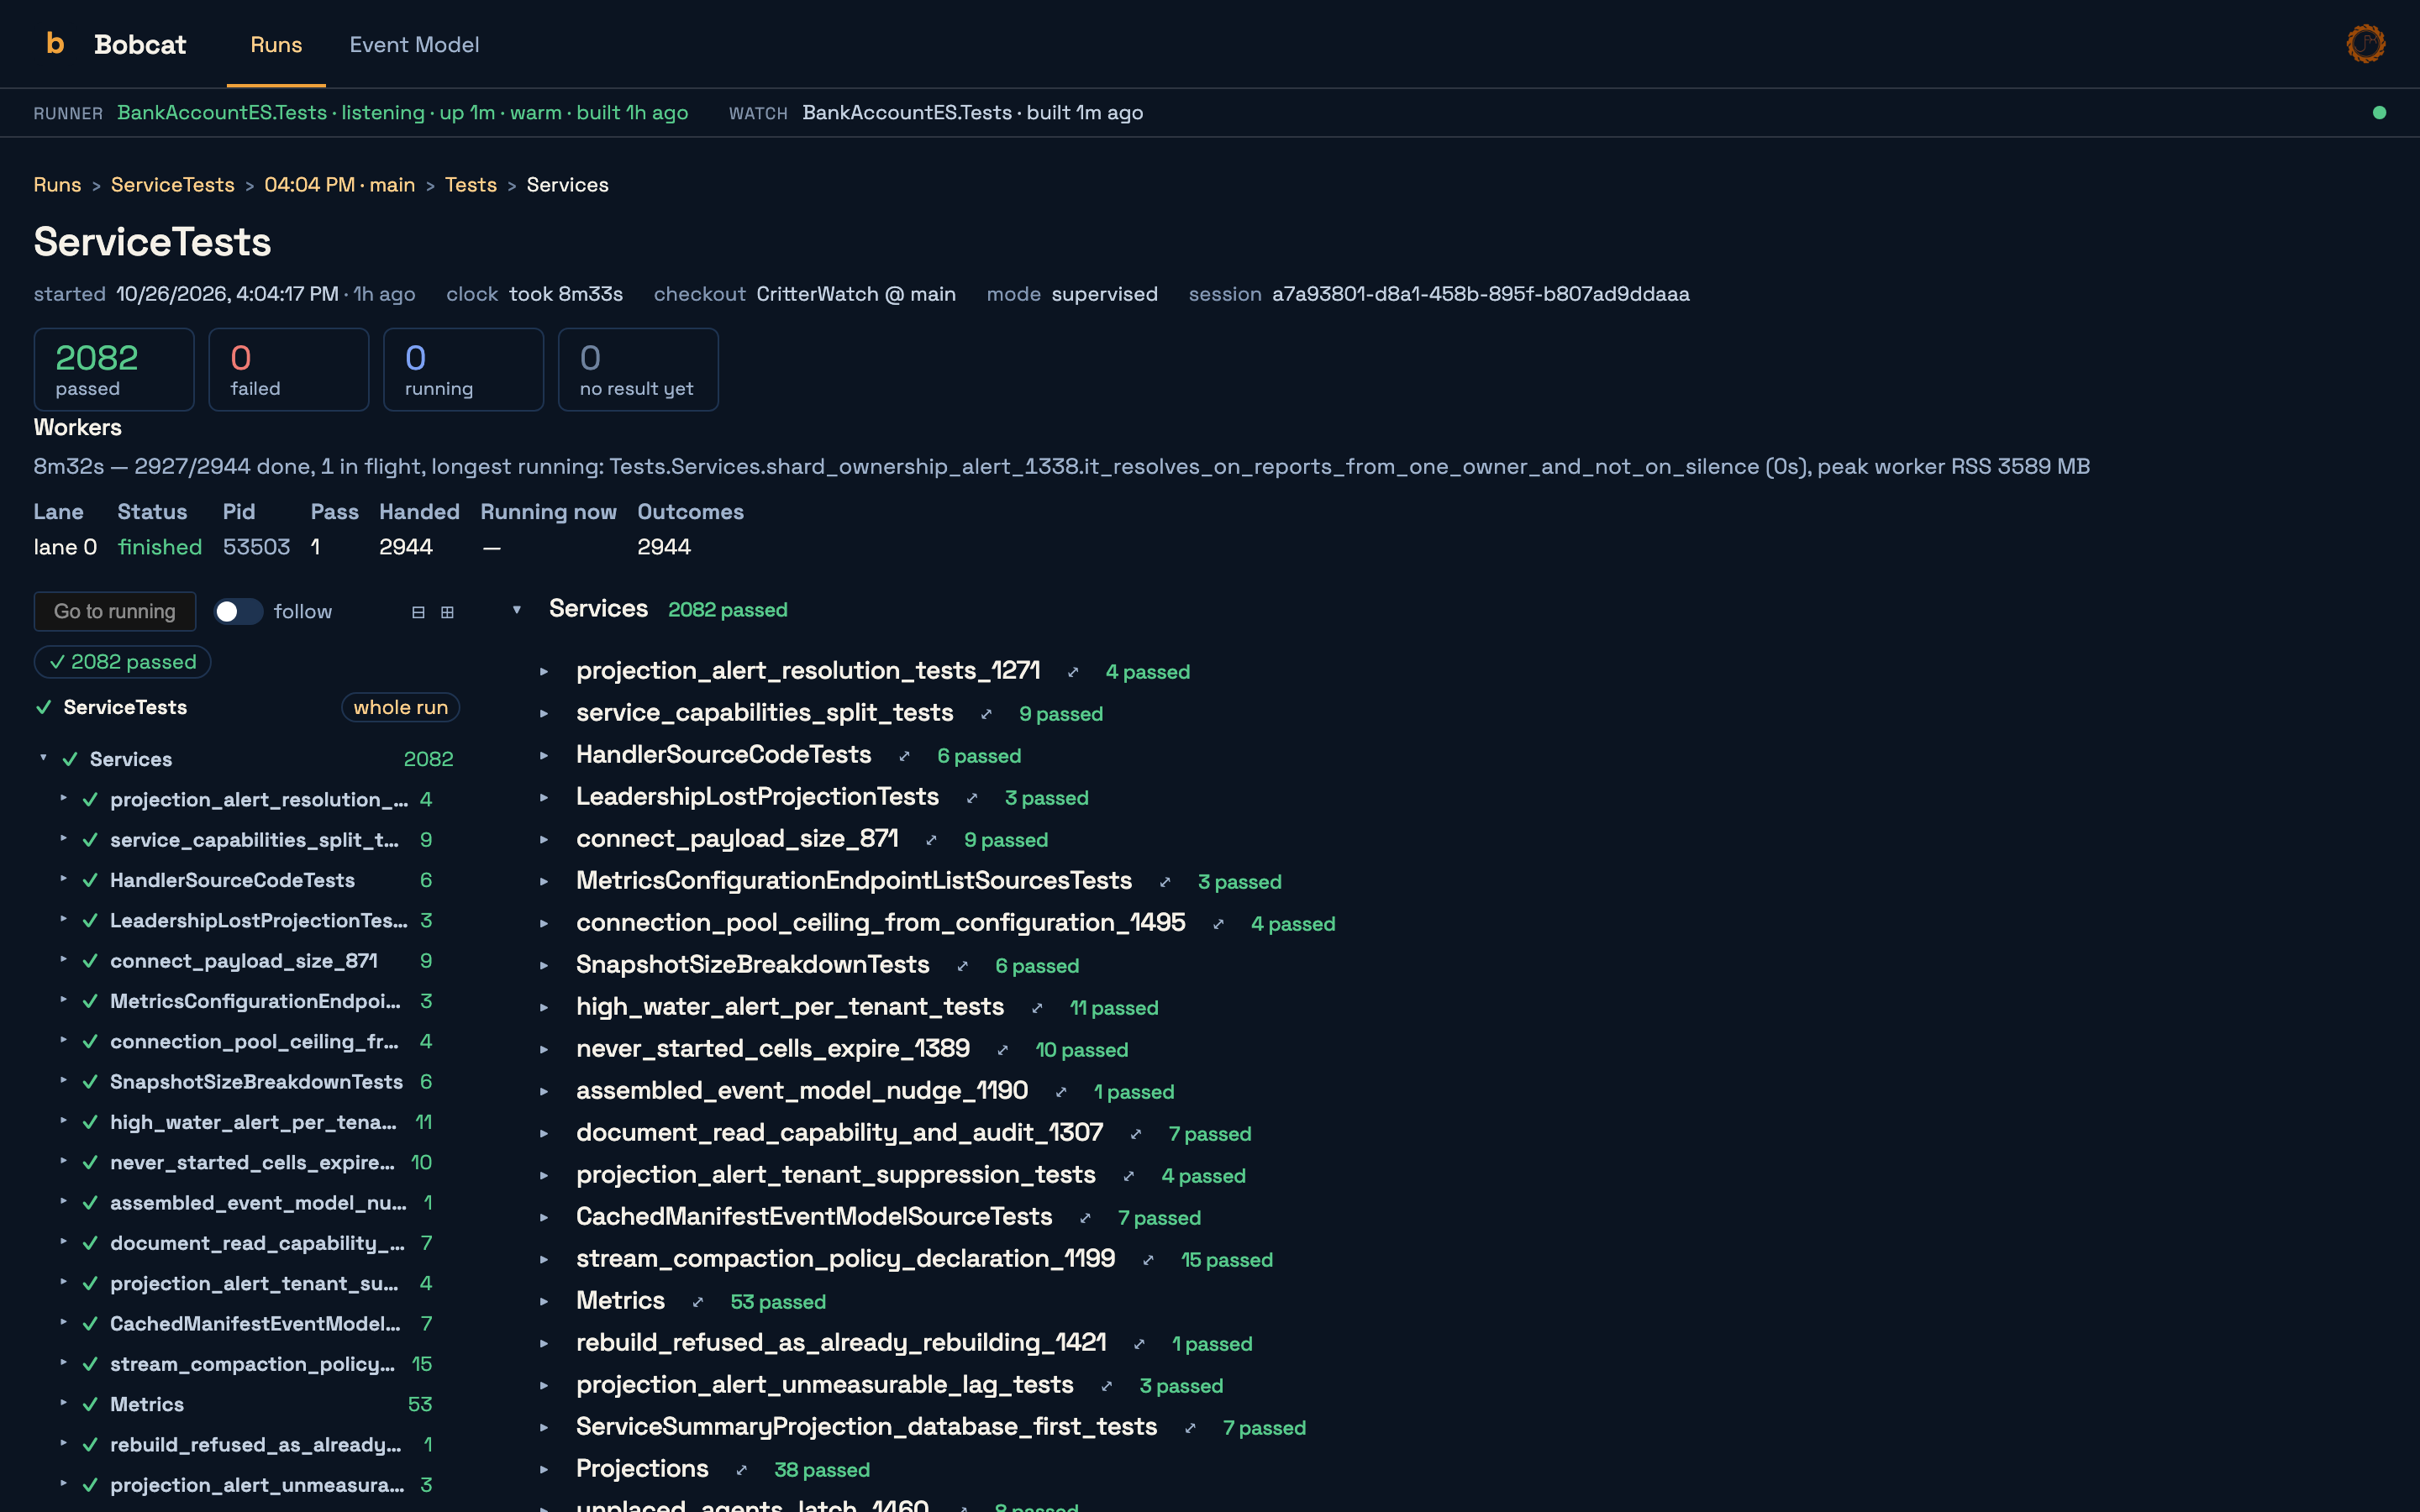
A supervised run of CritterWatch's 2,944-test ServiceTests, all green, opens as three folded nodes rather than one list of 2,944 lines:
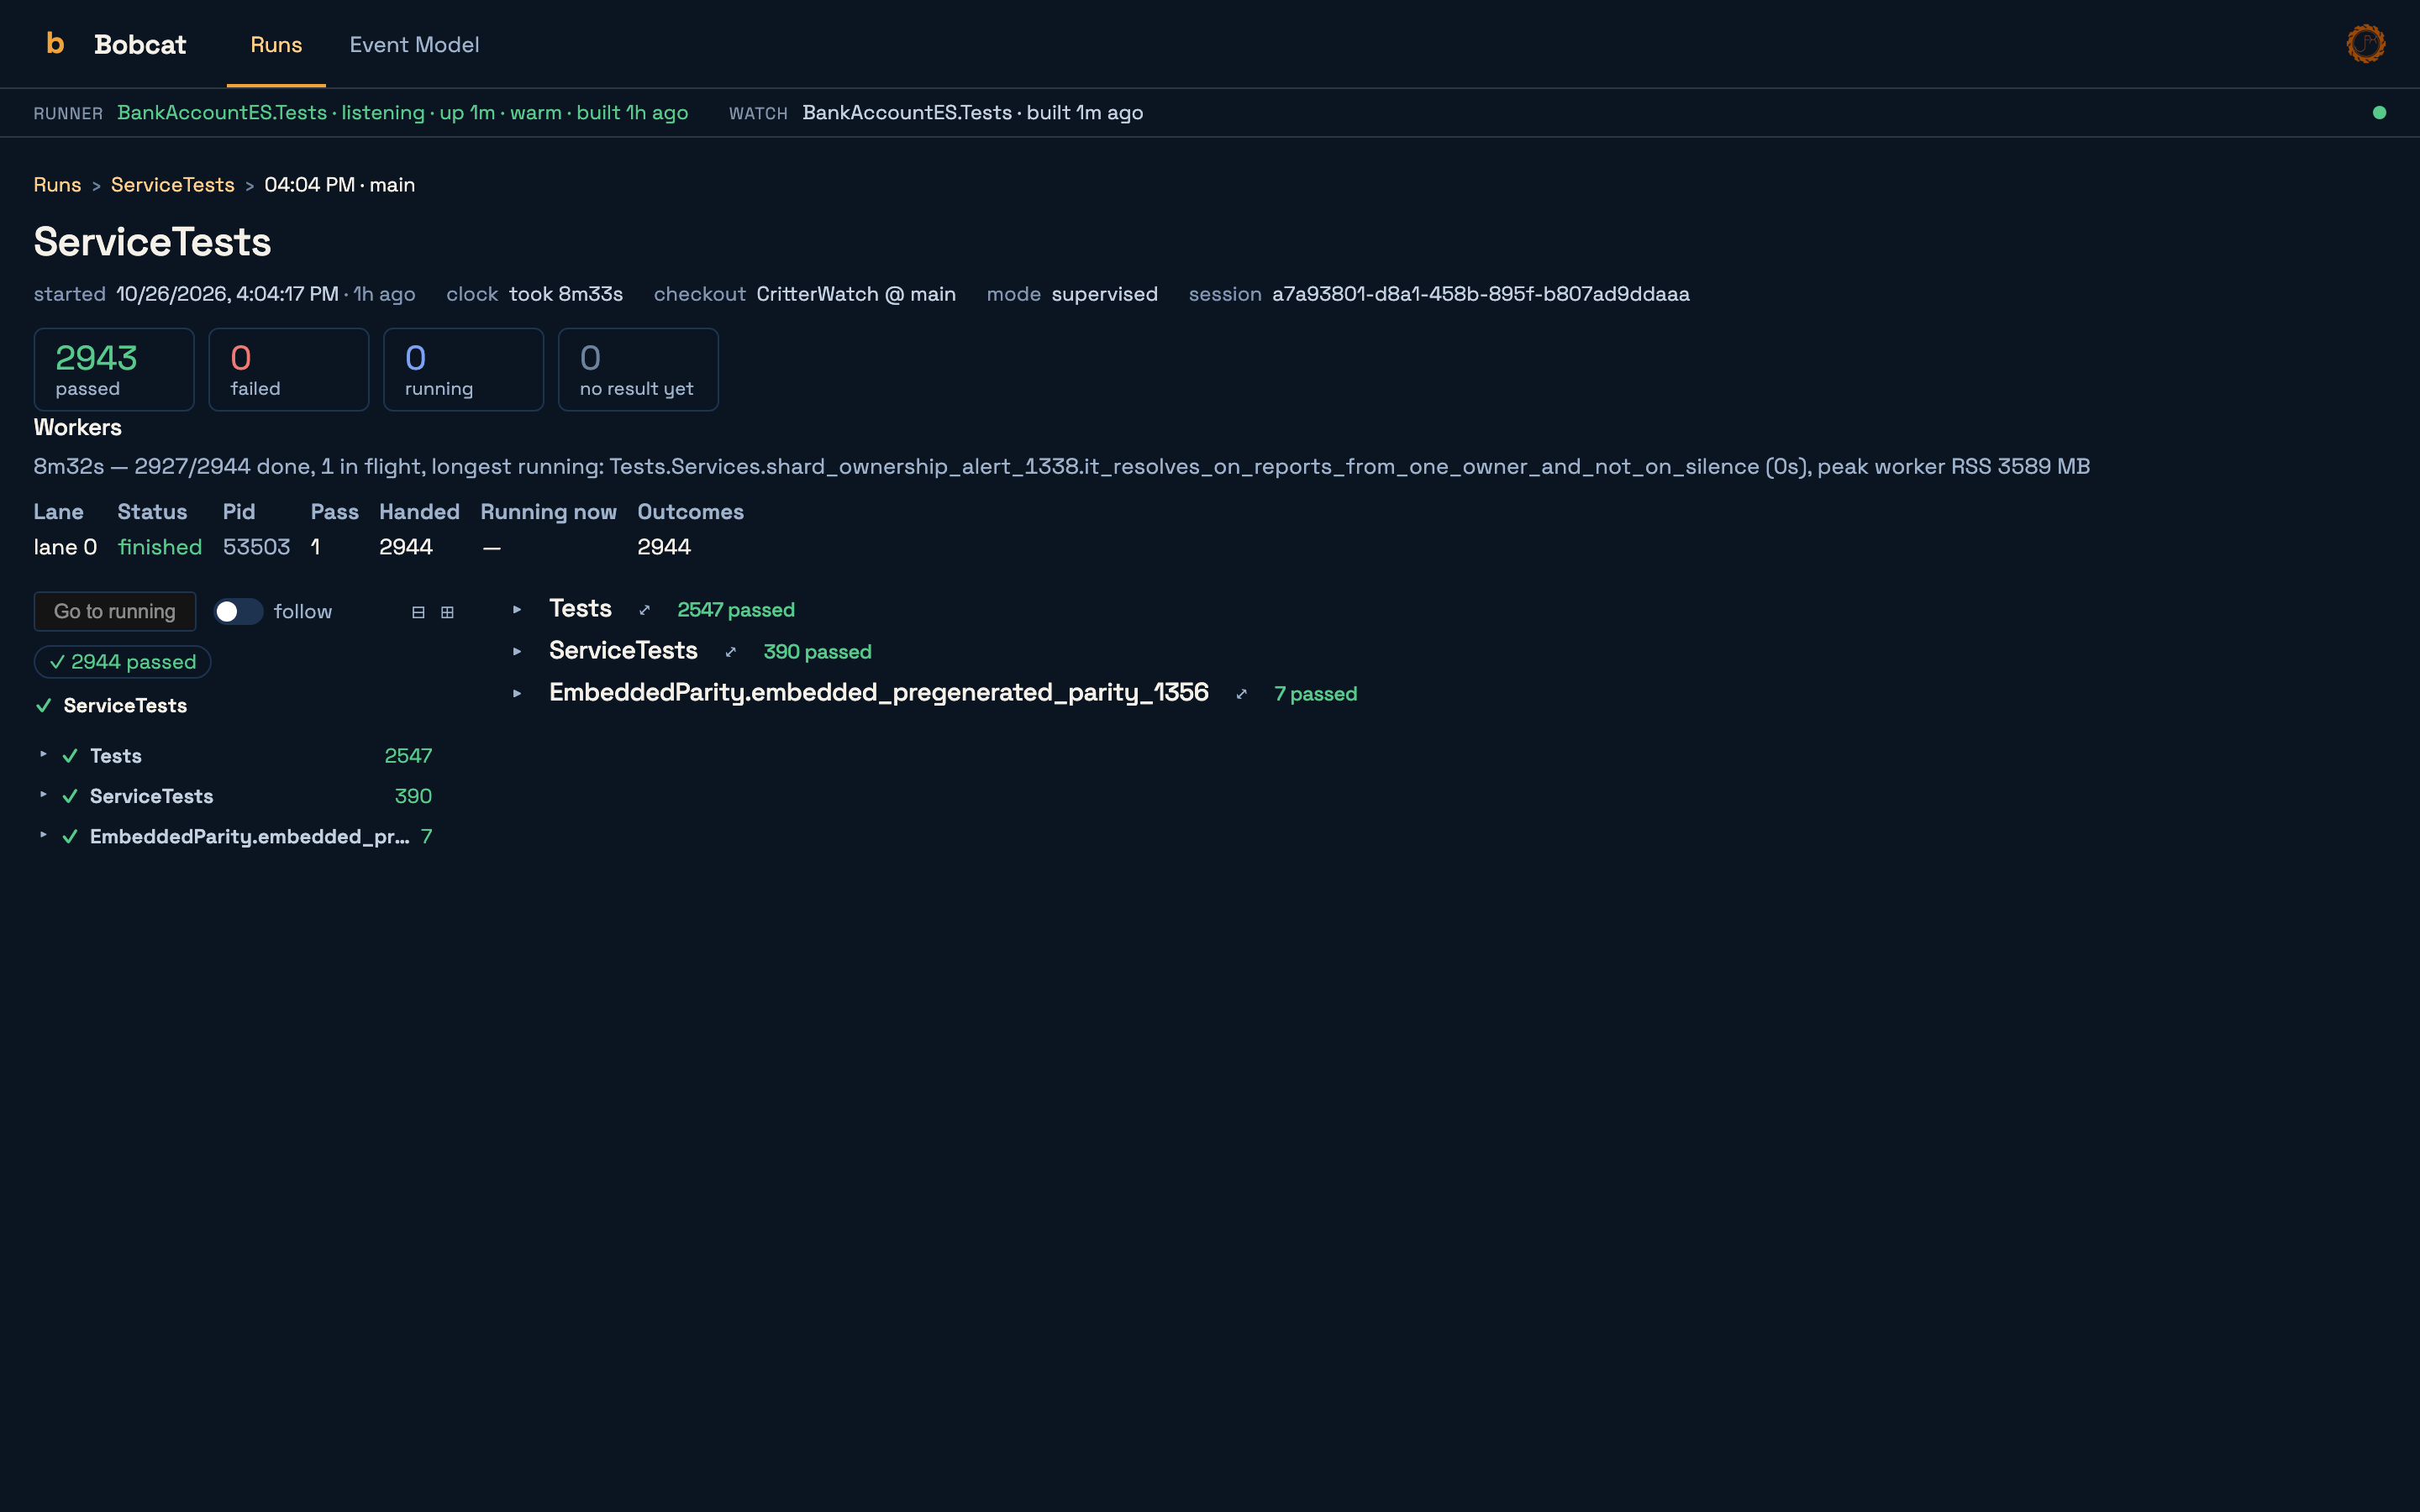
Zoomed into Tests.Services, the page is that node's 2,082 tests: the tiles count only them, the trail reads Runs › ServiceTests › run › Tests › Services, and each test class is a folded line with its count.
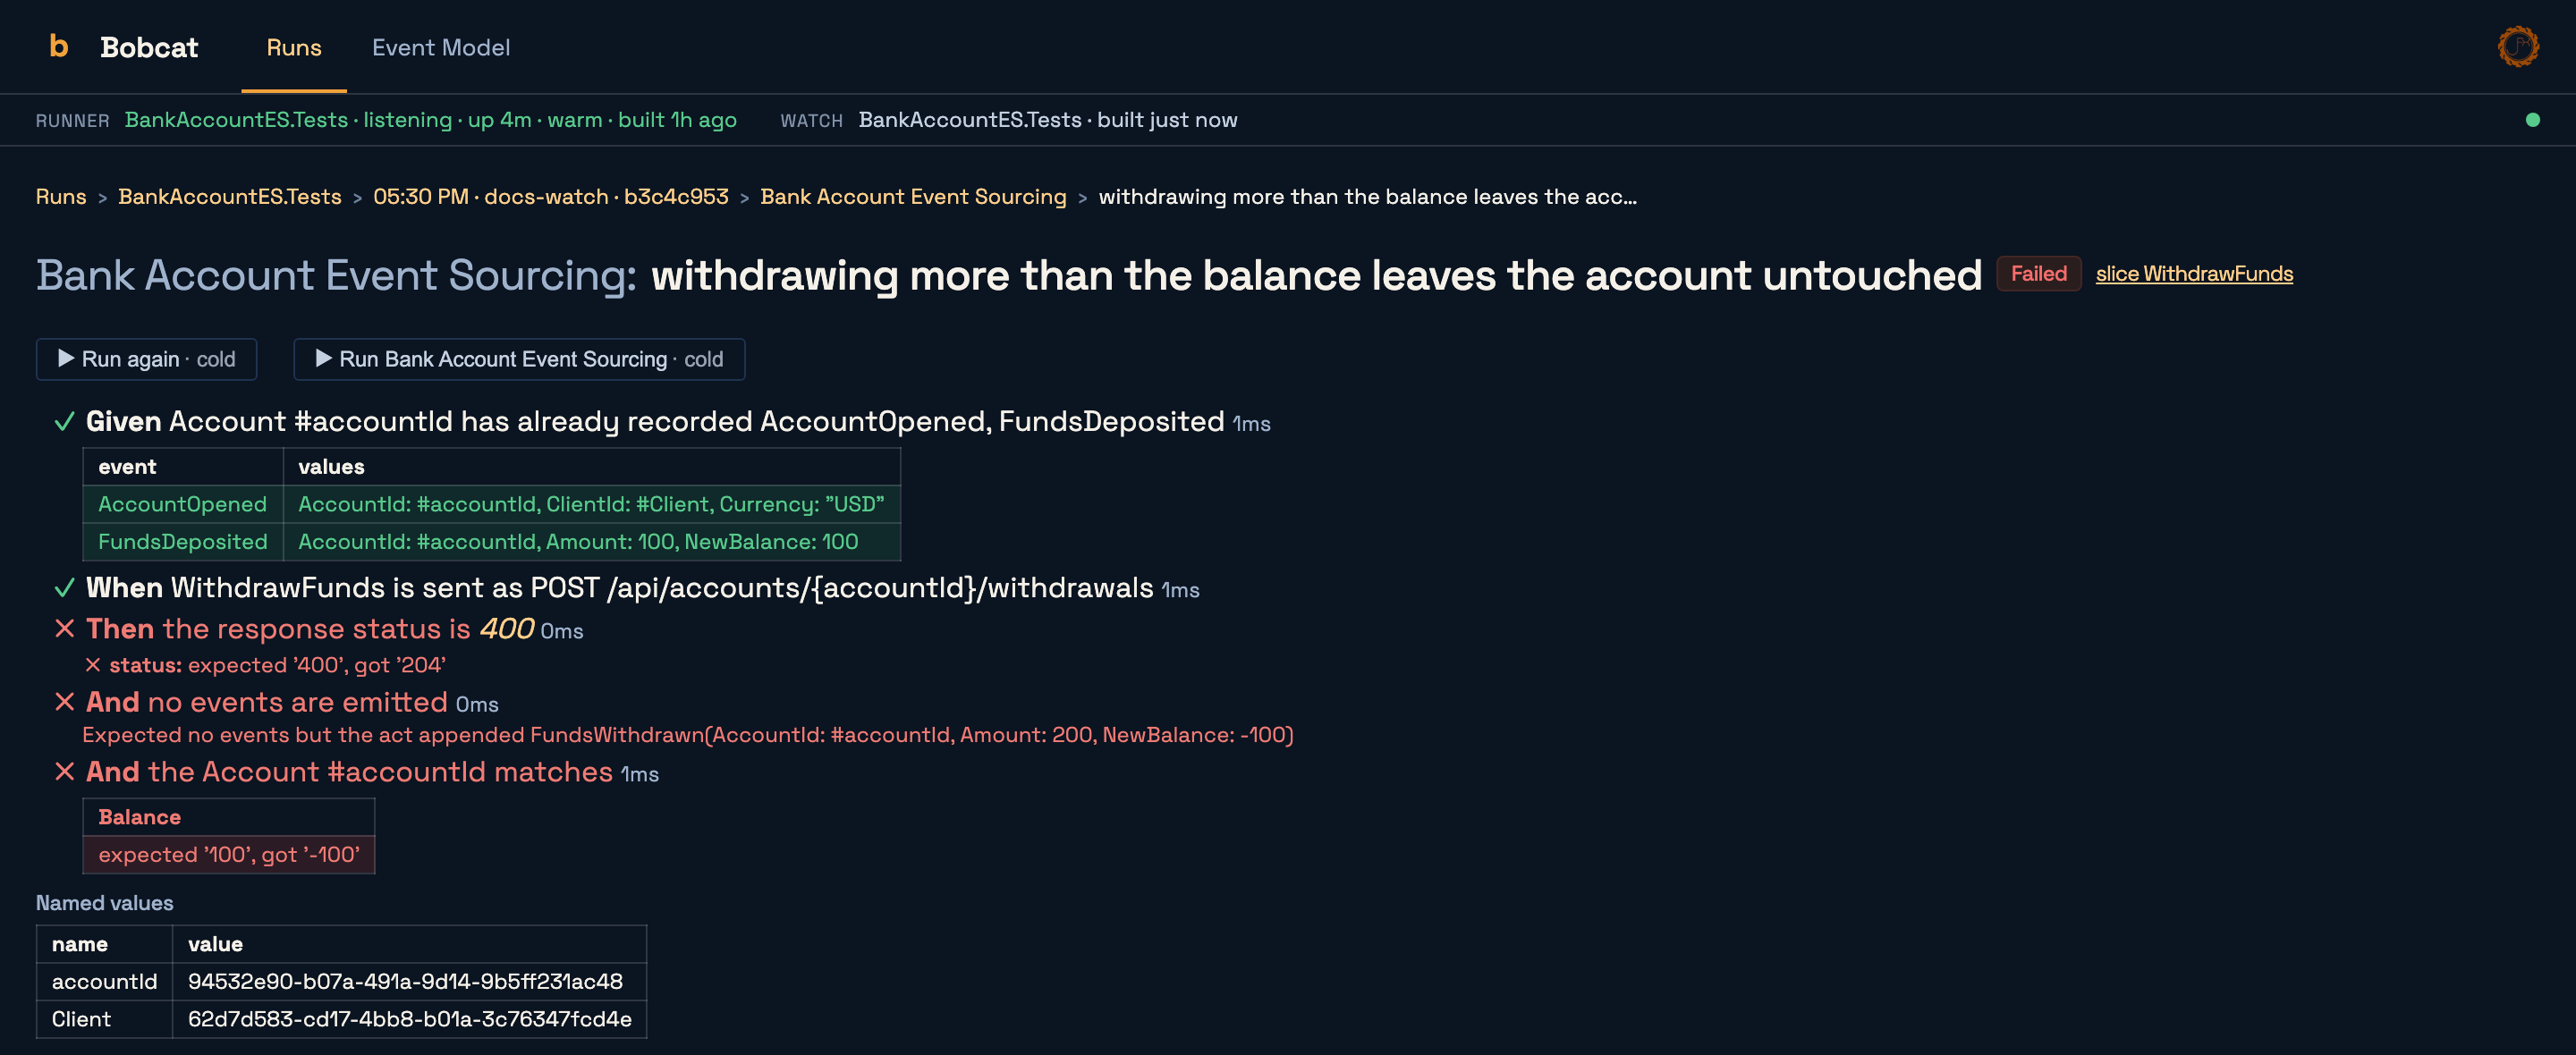
Each scenario has a page of its own at /runs/{runId}/specs/{Feature}/{Scenario} -- a URL you can paste into a pull request, with the same trail back, Runs › suite › run › feature › scenario, whose feature segment is the class for a supervised xUnit test -- that renders the specification the test produced: each step with its verdict and duration, each named comparison judged on its own (✗ count: expected '12', got '0'), tables as grids, the scenario's own reports beneath the steps (what the system did, as grids -- a failing scenario's, or every scenario's on a --verbose run), and an exception in a panel at the foot of the page with Bobcat's filtered frames.
The board loads in one request however many runs it holds: a summary per run, with its events fetched only when its page is opened or while it is live. The attached runners and the build reports are pushed to the page as they change, so nothing on it polls.
Run buttons
The Run again, Re-run failed, Run feature and (on the canvas) Run this slice buttons work when a resident runner is attached for that suite:
bobcat resident ./artifacts/MySpecsA runner registers what its suite specifies, and the buttons send it the identities to run, cold (a fresh test host on the current code) or warm (a test host kept open between runs). Every button says which it will send -- ▶ Run again · warm -- from the choice remembered in your browser, which the Cold / Warm switch in the dialog changes for every button at once; a runner with no warm host gets a cold run, and the dialog says so. With no runner attached, the button says how to start one.
The board gives every attached runner a row for its suite, before anything has run, with its state and a Run all button that runs its whole project; the status strip names the runner on every page. The row's runner link opens its page, at /runners/{runnerId}: every specification it can run, by feature, with the steps each one plans, and a run button for each feature and each specification. It is the UI's bobcat preview, and like it shows templates ({amount}) rather than values, because nothing has run. A run page's Run again runs every specification that run ran, whatever happened to them. Over the API, a command can name "all": true in place of specs or feature: the UI resolves it to every identity the runner registered.
A run a button started says so on its card and on its live progress panel -- Run 2 in feature Bank · warm · from bobcat-ui, or Run all -- and while it runs, how many scenarios have finished of the specifications it selected, which is also the planned total its bar is drawn against. The board keeps the latest finished runs of each suite (BOBCAT_MONITOR_RETENTION_RUNS, 5 by default), so pressing buttons can evict the run a page is open on. That page then says the run was evicted and where its archive is, rather than calling it unknown.
A resident runner relaunched on a rebuild registers again but runs nothing, so the UI follows it in three ways. The latest run of its suite is marked from before the last rebuild (the runner says when its host was built). Specifications it no longer has are dropped from the canvas's slices (a new one reaches the canvas with the next run). And pressing Run on an earlier run's page for a spec renamed since says the runner no longer has it, instead of blaming another suite. Re-running on a rebuild automatically is not done: a run nobody asked for costs a database and a CPU.
Exports
Every card exports its run, and so does GET /api/runs/{runId}/export?format=…:
| Format | |
|---|---|
| CTRF | the default and the richest -- retries, attempts, flakiness and steps all have fields of their own |
| JUnit XML | lossy, for the CI systems that ingest nothing else |
| NDJSON | the raw event stream the run published, exactly as it arrived |
The Event Model canvas
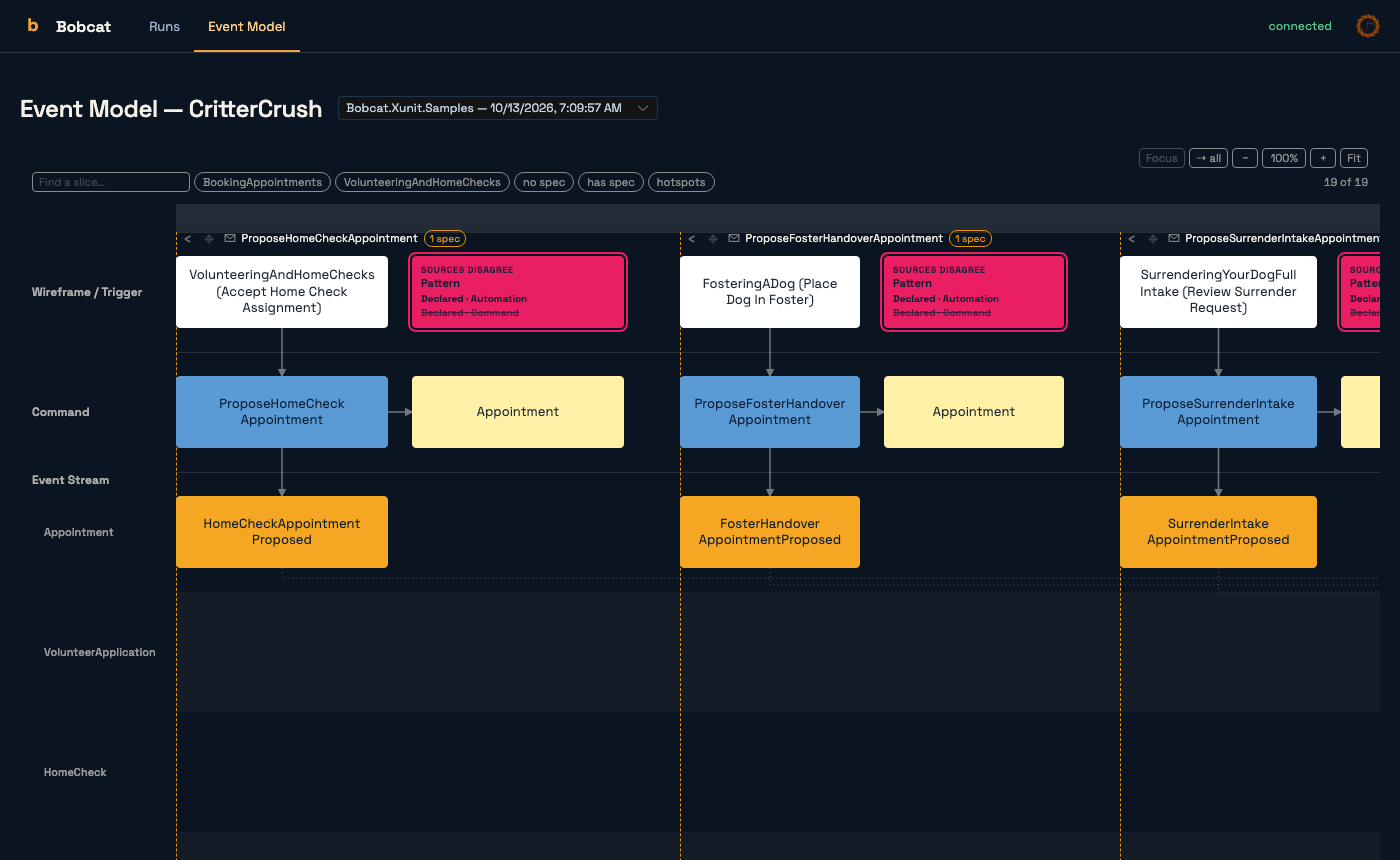
At /event-model. The canvas draws the Event Model -- chapters, slices, and each slice's trigger, command, aggregate, events, read models and external systems in the usual lanes -- with the same @jasperfx/event-model-vue renderer CritterWatch uses, so a model looks the same in both.
Getting a model onto it
A push names a model and a source, and the canvas merges every source naming the same model, so each producer contributes what it can see. A model usually has two halves, and they come from two different places.
The application's half, from the application. Its handlers, endpoints, aggregates and projections, and any overlay registered in Program.cs with AddEventModel, can be described only by the running application, and nothing pushes them for you:
dotnet run --project src/MyApp -- event-model --url http://localhost:5525/api/event-modelLive, as you edit. watch-event-model rebuilds the application on each change and pushes the model again, and starts a bobcat ui (with --no-browser --idle-shutdown) if none is answering:
bobcat watch-event-model src/MyAppThe specifications' half, from a spec run. A run that finds the UI publishes only what its spec assembly declares: the slices its [BobcatSpec] tests are bound to, the roles their steps stamp, and the specification identities that run outcomes join on. It never brings the application's handlers, its overlay or anything else the application derives. Wolverine's BankAccountES sample shows the difference: its spec runs publish 9 slices, while its 13 slices, the trigger labels from the overlay in Program.cs and the events its handlers really emit reach the canvas only from the application's push. A spec half is published under a source named for the spec assembly, and with the same never-slow-never-fail rule as everything else a run publishes.
The halves merge only when they name the same model: Wolverine names the application's model for its ServiceName, and [assembly: EventModelName("…")] names the spec assembly's. A spec half whose name looks like a misspelling of the model the UI is serving (BankAccountES.Tests beside BankAccountES) is not published, and the run says why on standard error. dotnet test does not show that message; run the test project's executable directly to see it.
From an eventmodelers.ai board, while you import it:
bobcat import-event-model board.yaml --url http://localhost:5525Hotspots that compare sources need both halves. A sources disagree hotspot is not pushed by anyone: the UI finds it when it merges a model's sources, where two of them describe the same slice differently. In BankAccountES, the application derives that FreezeAccount emits AccountFrozen and AccountFlagged, and its specification mentions only AccountFrozen. With only the application's half on the UI that model has no hotspot; it appears once a spec run has published its half.
Which model
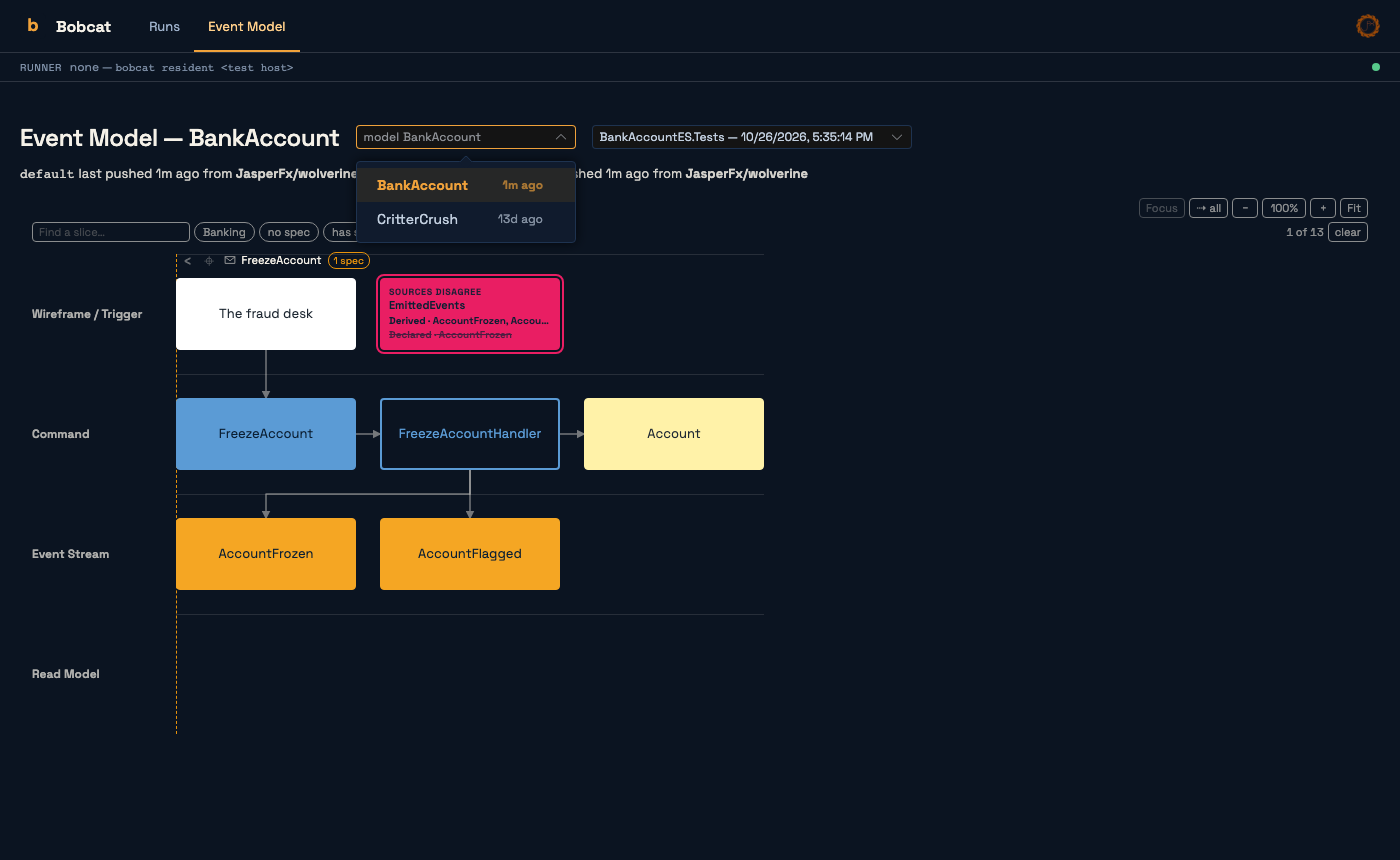
The UI keeps every model pushed to it, each with when every source was last pushed and the checkout it came from.
- The header says how fresh the model is. Under the model's name, each source is listed with when it was last pushed and the repository (and branch) it came from, so a model nobody has pushed for a fortnight says so. A source stored before the UI recorded push times reads last written, and its time is its file's. When the board has runs and none is from this model's repository, a tag says that too.
- A switcher, when there is more than one model. It lists every model, newest push first. The choice goes into the URL as
?model=, so a reload or a pasted link opens the same model. - Which model opens first. With no
?model=, the canvas opens on the most recently pushed model that has a source from a repository with runs on the board, or failing that the most recently pushed model of all.
The same lists are on the wire: GET /api/event-models lists the models with their sources, and GET /api/event-model?name=… reads one. A bare GET /api/event-model still serves the model pushed last.
Reading it
- Slices are coloured from a run. Pick a run from the selector at the top -- the newest by default -- and each slice takes the colour of its bound specifications' outcomes in that run. A specification that did not run there, and a slice with none bound, are drawn in the orange of drift.
- Hotspots mark what needs a decision: a specification declared but still pending, or sources disagree -- two sources describing the same slice differently, shown with both claims.
- Click a slice to open its drill-down: each bound specification with its outcome and a link to its rendered page, and the types the scenario actually touched, with any the model does not declare called out.
- Find a slice by name, filter to a chapter, to slices with or without a spec, or to hotspots, and zoom, fit or focus.
The links go both ways: a scenario bound to a slice links to that slice on the canvas, opened on that specification and coloured from that run.
Where it keeps things
Run history and Event Model documents live under ~/.bobcat/monitor/runs -- BOBCAT_MONITOR_DATA moves it. Each run is one NDJSON file of the events it published. Each Event Model has a folder under event-models/ (bobcat#799), holding one JSON file per source plus a pushes.json recording when and from which repository each source was last pushed. A UI from before #799 kept one event-model.{source}.json per source beside the runs; a newer UI moves those into the folders on startup and renames the originals *.migrated. A restarted UI replays all of it, so the board and the canvas come back as they were.
Two settings bound two different things:
| Variable | Default | What it bounds |
|---|---|---|
BOBCAT_MONITOR_RETENTION_RUNS | 5 | the board, counted per repository and suite. A run evicted from the board is ejected: its file moves to ejected/ and stays there |
BOBCAT_MONITOR_RETENTION_DAYS | 14 | the archive, by age. The only thing that ever deletes a file |
BOBCAT_MONITOR_ORPHAN_SECONDS | 30 | how long a live run may go silent before it is orphaned -- and so ejectable, and evicted like a finished run |
Zero or a negative number turns any of them off. The Eject button on a card does by hand what the board limit does automatically, and a live run is never ejected: orphaned first, then ejectable.
The board's count is per suite, where a suite is the repository plus the suite name: the repository is the owner/name read from the checkout's git remote, the same identity the board's repository filter groups by. Every branch and every worktree of a repository therefore counts against one allowance -- five finished runs of Bobcat.Xunit.Samples across all of a repository's checkouts, not five per checkout -- and the branch stays a property of the run shown on its card. A run whose path is not a checkout on this machine (one published from another box) is grouped by that path.
The same settings also read as configuration keys, Monitor:DataPath, Monitor:RetentionRuns, Monitor:RetentionDays, Monitor:OrphanSeconds and Monitor:IdleMinutes, which win over the variables when both are set. For the global tool the environment is the practical way to set them, so the variables above are the spellings to use.
Querying it from the command line
The same runs and model are readable as JSON from the bobcat tool, which is how an AI agent reads them: bobcat failing-tests, bobcat failing-spec, bobcat slice-coverage and the rest. See Querying Runs from the Command Line.
For a run kept as a file rather than watched live -- a CI artifact, say -- see the JSON results file and the HTML results page, which renders a scenario with the same components the UI uses.
Troubleshooting
"Could not listen on http://localhost:5525 … Something else holds the port." Another bobcat ui is running, or a Stoat host, which also binds 5525 today. Stop the other one, or run this one with --port and point publishers at it with BOBCAT_MONITOR_URL. To see what holds the port:
lsof -i tcp:5525 # macOS and LinuxA run never appears. The probe happens once, at the start of the run, so a UI started afterwards misses that run. Check that BOBCAT_MONITOR is not 0 and that BOBCAT_MONITOR_URL, if set, names this UI.
The canvas says there is no model. Nothing has pushed one yet: use one of the sources above.
Slices stay uncoloured. The selected run has no scenarios whose identities the model's slices bind. Pick a run of the spec suite that binds them, and see Spec Identities for how the join works.